Is it 2007 again? There’s so much talk online about today’s housing market being like 2007, but what are the stats showing? Today I want to walk through three parts of the market. I suspect many locations are experiencing the same trend as Sacramento too. Skim by topic or digest slowly.

UPCOMING (PUBLIC) SPEAKING GIGS:
9/26/23 Orangevale MLS Meeting
9/28/23 Yuba City Big Market Update (in Yuba City (register here))
10/4/23 KW Sac Metro Big Market Update (register here)
10/6/23 How to Think Like an Appraiser at SAR (register here)
10/27/23 AI Fall Conference (San Francisco)

It’s a strange market today with low volume and low supply. It feels a little amateurish to call it weird, but that’s a pretty good description.
THREE WAYS TO COMPARE 2007 & 2023
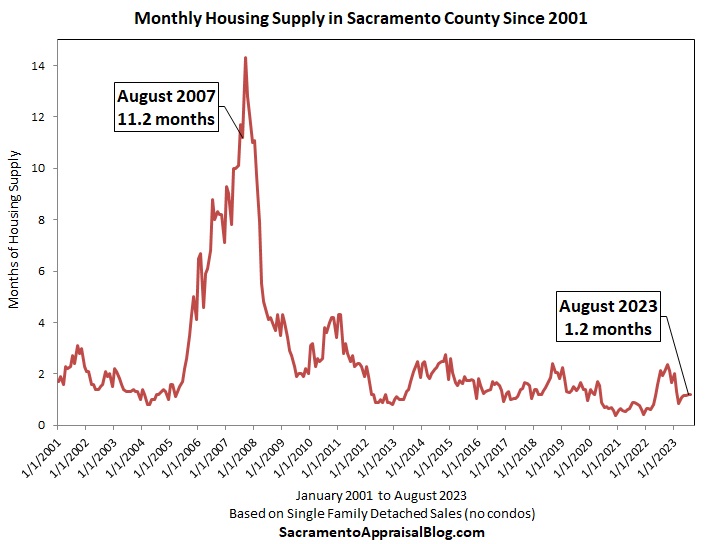
1) INVENTORY IS NOT BUILDING LIKE BEFORE
One thing that is REALLY different today is inventory is not building like it did in 2007. Supply has actually been subdued in today’s market as sellers have pulled back from listing their homes, and that’s the opposite of what we saw between 2005 and 2008. In fact, when prices peaked in August 2005, housing supply literally tripled in one year in Sacramento. Prices weren’t all that impacted the first year, but in the background, there was a tidal wave of supply building. Look, I’m not trying to sugarcoat today’s market, but we have a different vibe today where supply is not showing 2007 vibes. Granted, this doesn’t mean the market is healthy today. I’m just saying it’s way different.

Housing supply is actually lower today than one year ago.
New listings are down 34% from last year and 44% from the pre-2020 normal. Basically, we’re missing 7,700 new listings in the entire region compared to last year and 11,900 from the pre-2020 normal. I don’t have stats for 2007, but do you see what was happening in 2008? Yikes.

2) LOW VOLUME TODAY FEELS LIKE 2007:
One part of the housing market that feels really similar to the previous housing crash is the number of sales happening (volume). In 2005 prices peaked, and while prices weren’t down all that much the first year, the real change was seen in volume falling off a cliff. In real estate it’s easy to obsess over prices, but the real trend is often seen with volume.

We’ve basically had the lowest volume we’ve seen through August, so today really does feel like 2007 in terms of volume.

Not to beat the dead horse, but here’s another way to look at volume.

3) COMPETITION DOESN’T SMELL LIKE 2007
The stunning part about today’s market is how competitive it is in the midst of some of the worst volume ever. This is why I often call today a hybrid market. It’s like 2007 volume and 2020 competition gave birth to 2023.

Here’s a different way to compare competition in 2023 and 2007. Any dot above the 0% line went above the original list price, and anything below went below. Striking difference, right?


And days on market:


CLOSING THOUGHTS:
First of all, what happened last time isn’t the new template for every future housing correction, so even though I’m ironically writing a post about 2007, let’s remember that 2007 isn’t the new formula for every future downward cycle. With that said, today’s housing market feels like 2007 with volume, but it’s an entirely different beast with low supply, intense competition, and very few foreclosures. Ultimately, it’s not accurate to call this 2007 because it feels so different. Every time someone says it’s 2007, a puppy dies. Okay, that’s probably not true, but we do need to let stats form our narrative.
Though like 2007, we’re in a place where it would be healthy for prices to come down so more buyers and sellers can participate. The reality is sellers sitting back this year has so far catered toward keeping prices higher rather than fostering more much-needed affordability. I know, to some people it sounds like real estate sin for me to say this, but we have an affordability problem, and it’s not a healthy dynamic to see higher prices with lower volume. That’s not good for buyers, sellers, or real estate professionals.
What’s going to happen ahead? It’s impossible to predict the future with certainty since we’ve not had a market like this before. We have ideas for how long sellers might sit out, but the truth is nobody knows for sure. What happens with rates is a huge factor, and rates have persisted to be stubbornly high. No matter what, it’s important to not minimize the struggle of affordability today. In a traditional system low supply can help keep prices higher, but we’re not in a traditional market today, so over time we’re going to find out which is the more meaningful force. Affordability or low supply.
For now, we have a market that feels very stuck with a good chunk of sellers and buyers on the sidelines. It won’t be this way forever, but we seem poised to continue to see low volume and low supply until something changes the trajectory of the trend (rates, economic pain, etc…).
It does feel like 2007 in some ways, but in other ways it’s just so different.
—————— LOCAL HOUSING MARKET RECAP ——————
 I have so much to say about today’s housing market, but let’s keep this short and sweet. I’ll push out a ton of stuff these next two weeks on my blog and my socials. Basically, we’re experiencing a pretty normal seasonal slowing so far. It does not feel like the crash-landing market last year in 2022 where most metrics saw incredibly sharp change. Basically, all the metrics are showing pretty normal seasonality so far (and they’re even more competitive than the pre-2020 normal). It looks like prices and volume have peaked for the year, which is normal to see. It’s worth noting we’re starting to see slightly higher prices compared to one year ago. Of course, volume is depressed and inventory is still sparse, so it’s a strange market.

SHARING POLICY:
Please share some of my images on your socials or in a newsletter. Here are 6 ways to share my content (not copy verbatim). Thanks.
ANNUAL STATS
Remember, some annual stats like volume get a little weird because we’re now comparing today with a slumping market last year. But we still need to know these numbers, so I’m going to be pushing them out.


EL DORADO STATS:
Someone in the comments asked about El Dorado stats. Send me an email if you want some stuff. lundquistcompany @ gmail dot com.
MONTH TO MONTH:


JUST A FEW IMAGES:


I hope this was helpful.
Questions: What are you seeing out there in the market? What stands out to you above? I’d love to hear your take.
If you liked this post, subscribe by email (or RSS). Thanks for being here.