The market is getting hotter, but it’s also pretty flat. Let’s talk about this as well as low rate addiction. Then for those interested I have a huge local market update.

Two things:
1) Competitive but flat market: The spring market is definitely competitive. Real estate agents are saying it’s “hot” and they’re right because buyers are hungry, sales volume is up, and it’s taking less time to sell. BUT prices also seem a little flat. I know, that sounds crazy since there’s so much competition, but it’s what the stats are showing. Let’s remember it’s possible to have a market with lots of competition while prices are more subdued or sideways. In other words, just because it’s competitive doesn’t mean prices are going nuts.
2) Rate addiction: Lower rates in 2019 have brought buyers back into the market after a big slump in 2018. It just goes to show how sensitive our market is to rate changes. In other words, it seems the market is struggling to move forward in glory without low rates. Sounds healthy, right?
Any thoughts?
—–——– Big local monthly market update (long on purpose) —–——–
Spring is feeling fairly normal so far and March was actually a strong month. Let’s talk about this.
 THE SHORT VERSION:
- Price growth is definitely slowing
- Sales volume has slumped for 10 months
- Volume was strong in March though
- Choose comps wisely
- I’m now publishing El Dorado County stats
- Most metrics are doing what we’d expect for the spring
- This post is long on purpose. Skim or pour a cup of coffee.
DOWNLOAD 70+ graphs: Please download all graphs here as a zip file. See my sharing policy for 5 ways to share (please don’t copy verbatim).
THE LONGER VERSION:
Here’s some of the bigger topics to consider right now.
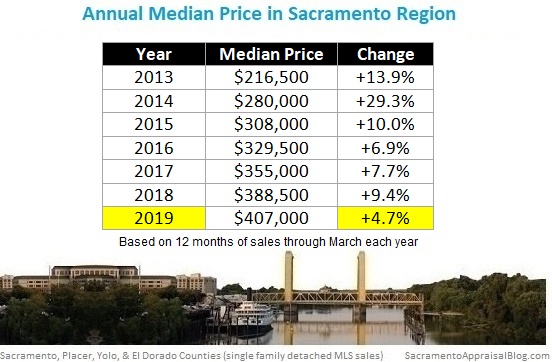
Slow or flat price growth: The median price in Sacramento last month is actually the same as it was one year ago. It’s been a very long time since we’ve seen that happen. Otherwise most other price metrics in the region are up slightly between 2-3% over the year. This is a very modest change over twelve months and it reminds us price momentum is slowing. In many areas it seems prices are hovering around or lower than they were during the height of summer. But keep in mind this isn’t totally abnormal for the spring either because sometimes the new year immediately picks up right where it left off during the height of summer and other times the stats don’t get back to where they were until about May or so. Thus in some senses we’re still waiting to see how this spring market is going to unfold.
A more normal-ish spring: Overall most metrics look normal for the time of year. Prices ticked up again from the fall lull, it took eight less days to get into contract from last month, and there just isn’t that much on the market right now. Part of having an anemic number of listings is normal because the market doesn’t tend to hit its stride until April, but we’re also seeing the byproduct of buyers devouring listings because of low rates.
Choosing comps today: When a market is showing slower price growth it’s important to be realistic about comps. Sellers often want to get super aggressive, but I have some quick advice. Don’t. Give strong weight to similar properties that are getting into contract, and don’t price like it’s the rapidly increasing market from yesteryear. It’s not. Remember, in some areas you might pull comps and not see much price difference at all from the summer of 2018 or even from the spring of last year. Sellers, please remember you are not guaranteed price growth, so don’t price like you’re entitled to it.
Improving volume, sort of: Sales volume definitely made a rebound last month from the profound dullness we saw these past two quarters, yet it was still down 5.7% in the region from last March. And it’s down 7.2% over the past twelve months. Think about it this way. Being down seven percent doesn’t sound like much, but it means there’s been more than two thousand less sales this year in the Sacramento region compared to last year. It sounds bigger when we think of it that way, right? While volume improved this past month, we’ve still had ten months in a row of lower volume, and that’s the bigger story. Moreover, the first quarter was down 10% in the region compared to last year.
Pendings show us the market: Sales from March tell us more about what the market used to be like in January and February when these homes got into contract. So we have to look to the listings and pendings right now to understand where the current market is really at. As of now pendings look pretty strong, which suggests we’ll have another month of stronger volume in April.
Less offers (but actually more): Multiple offers are down about 12% in the region this year compared to last year, but the number of multiple offers actually increased from February to March. This is exactly what we’d expect to see happen in the spring, so don’t write home over it. But it’s still interesting to see.

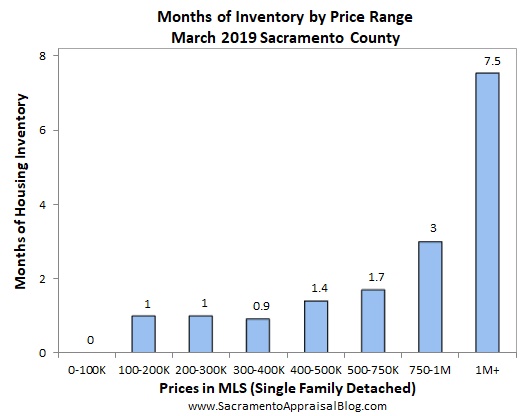
Price sensitivity: One out of every two homes are getting multiple offers in Sacramento County, and it’s a reminder buyers need to bring strong offers. But sellers ought to price correctly too. Buyers are not desperate and willing to pay unrealistic prices, so I advise aiming for the market instead of that one mythical buyer who will overpay for some reason.
Waiting: We’re waiting and needing a few more months of data to see how this year is going to unfold. It’ll be most interesting to see if we get a little more price growth too (beyond just rebounding from the dull fall). The verdict is not in yet for this year, and there is still an element of uncertainty because we have a market that feels heavily driven by low rates for the time being.
I could write more, but let’s get visual instead.
BIG ISSUES TO WATCH:
1) SPRING GETTING HOT TECHNICALLY: The market is heating up for 2019. We’re seeing price changes, lower inventory, and increased sales volume. So prices are up from the dull fall, but they’re also flat as you can see under #4.


The median price is actually down in Placer County, but I’d suggest waiting a few months before making a big deal out of that since Placer County doesn’t have many sales each month, so data can be a little more volatile Yet this hasn’t happened in a long time either.

2) SLOWING MOMENTUM: Despite the heating, stats show the market is slowing down when we look at the rate of change by year. Looking at monthly, quarterly, and annual numbers helps give a balanced view of things.


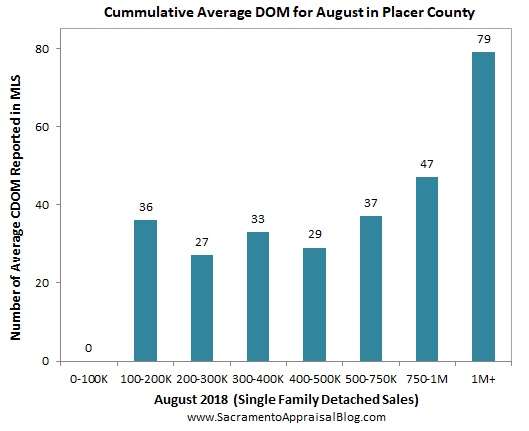
3) SALES VOLUME SLUMP for 10 months: It’s important to look at sales volume in a few ways to get the bigger picture. Here it is by month and year.
SACRAMENTO COUNTY:
Key Stats:
- March volume down 4.9%
- Volume is down 6.2% over the past 12 months


SACRAMENTO REGION:
Key Stats:
- March volume down 5.7%
- Volume is down 7.2% over the past 12 months


PLACER COUNTY:
Key Stats:
- March volume down 5.5%
- Volume is down 7.7% over the past 12 months

EL DORADO COUNTY:
Key Stats:
- March volume down 8.9%
- Volume is down 9.0% over the past 12 months

4) LAST YEAR VS THIS YEAR: It’s been a LONG time since we’ve seen some metrics almost identical to what they were last year. Can you see why I’m saying prices seem flat lately? This may not be true in every single price range or neighborhood of course, but this shows us price momentum is slowing. With that being said, it’s still okay to say the market is “hot”. It is. But I’d say competition is hotter than price appreciation.


Quick note on how NOT to use my content: Please don’t copy my post verbatim or alter the images in any way. I will always show respect for your original work and give you full credit, so I ask for that same courtesy. Here are 5 ways to share my content.
Now here are a bunch of images. Please enjoy.
SACRAMENTO COUNTY (more graphs here):


SACRAMENTO REGION (more graphs here):


PLACER COUNTY (more graphs here):


EL DORADO COUNTY (more graphs here):


DOWNLOAD 70+ graphs: Please download all graphs here as a zip file. See my sharing policy for 5 ways to share (please don’t copy verbatim).
Questions: What are you seeing out there? What do you think prices are doing? What are you hearing from buyers and sellers lately?
If you liked this post, subscribe by email (or RSS). Thanks for being here.