There are lots of big questions in life. Are you playing Wordle? Did you like the Super Bowl halftime show? And what are rising mortgage rates going to do to the housing market? Let’s talk about this.

Okay, really quick. Yes, I play Wordle almost every day. And yes, I liked the halftime show. What about you?
UPCOMING PUBLIC SPEAKING GIGS:
- 2/18/2022 WCR El Dorado market update (details)
- 2/25/2022 Placer Assn of Realtors market update (details)
- 3/15/2022 NARPM Luncheon (details)
- 3/22/2022 SAFE Credit Union market update (details)
- 4/28/2022 SAR Think Like an Appraiser (details)
My take on mortgage rates: For now, buyers have been sprinting to the market to get in before rates rise. This has created an auction-like feel in the home-hunting trenches. Thus, for the time being the hot housing temperature has not been dampened by rate increases. But as we saw clearly in 2018, there was a point where buyers backed off when rates rose between 4.5-5.0%. So, rate increases do matter. The struggle is we’re having fewer sellers list their homes, so even with rate increases, supply is just so diminished that there is more upward price pressure present today. All that said, we can’t expect for the housing temperature to stay exactly the same if affordability keeps declining through rate increases and inflation. Again, we haven’t hit any sort of inflection point where buyers pull back, but we need to keep an eye on what happens with rates because absurdly low rates have been a huge driver in creating the market we’ve had these past two years.
A non-scientific Twitter poll I did a few days ago:

What do you think? I’d love to hear your take.
Thanks for being here.
—–——– BIG MARKET UPDATE FOR THOSE INTERESTED ———––
 Skim or digest slowly.
QUICK SUMMARY:
Is the market more or less aggressive compared to last year at the same time? So far, the housing market in Sacramento is slightly less aggressive when considering January stats. But let’s remember we are now comparing this year with an absolutely insane market from January 2021. Anyway, the stats show today’s market is profoundly elevated from a normal January, but it’s also slightly “slower” than last January. Stay tuned to see how the stats evolve in coming months. And remember, our housing narrative changes as stats change.
Dude, volume was down? Let me address something since people keep asking. Sales volume in January 2022 was down about 5% from one year ago. It’s easy to look at this and say the market is starting to struggle, but this January was actually fairly normal when we consider the past few years. It’s just that 2021 was elevated because we basically didn’t have a fall season in 2020, which led to more sales than usual.
A quick recap:

Some visuals eh…
SHARING POLICY: I welcome you to share some of these images on your social channels or in a newsletter. In case it helps, here are 6 ways to share my content (not copy verbatim). Thanks.

MOVING ON UP:
The black line is the weekly median price. This is a weekly view before monthly stats come out for February. Do you see the rise? Yep, prices are going up (not a shocker). Moreover, when looking at pending contracts, we are seeing a higher percentage of multiple offers compared to January, so clearly the market is getting hotter (normal for the spring).

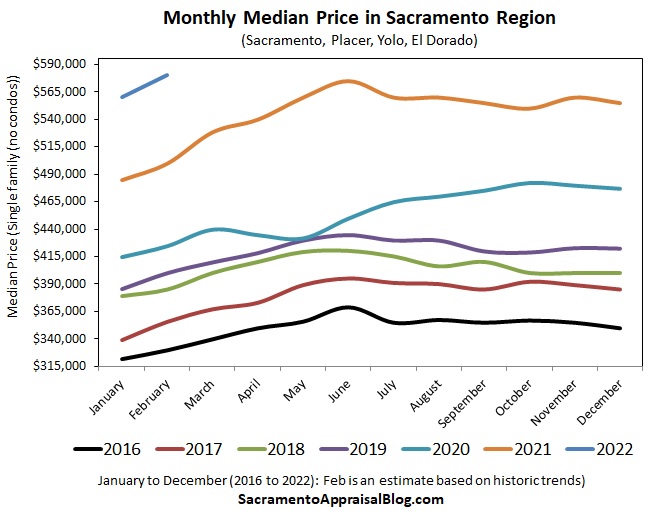
Here are a couple of monthly visuals too. The second one shows the preliminary median price for February. This year we are on the cusp of breaking $600,000 for the median price. We’ll see.

YEAR OVER YEAR:
Year over year stats are important to digest, but don’t forget to look at month to month stats to understand what the market is doing right now.


STILL SELLING ABOVE THE LIST PRICE:
Not everything sells above the list price. It almost offends some people to say that, but it’s the truth. I know it feels like literally everything is selling above the list price, but that’s not the story the stats tell. Think about it this way. There are always price reductions because not all properties are priced correctly, right? So, this means not everything is going to sell above the list price. Anyway, the key here is to ask what normal looks like. In January we should’ve seen properties selling about 3-4% below their list price, but instead we were just above the list price on average. Here is a quick discussion on my Facebook page about what normal looks like for January compared to what we have right now.


HOW IS THE MARKET DISTRIBUTED?
This visual shows how prices are distributed throughout the market. Do you dig this one?

FRESH AFFORDABILITY IMAGES:
There is no mistaking prices have risen and the housing market is becoming more difficult to afford, but stats still show buyers are getting it done when we look at sales volume being more or less normal. This is not to gloss over the reality of some buyers being priced out of the market. I’m just saying statistically sales are still happening at strong levels. But back to affordability, here is a look at the latest affordability stats. The 39% figure means 39% of households can afford the median price (per CAR stats).


MULTIPLE OFFERS:
We’ve started to see multiple offers increase again, which is normal for the spring season. In short, multiple bids are lower than last January, but they’re far elevated beyond normal. And pendings are getting a higher percentage than January already, so this line on the right is poised to tick up.

OTHER VISUALS:
As if anyone really wanted more…


MARKET STATS: I’ll have lots of market stats out this week on my social channels, so watch Twitter, Instagram, LinkedIn, and Facebook.
Thanks for being here.
SHARING POLICY: I welcome you to share some of these images on your social channels or in a newsletter. In case it helps, here are 6 ways to share my content (not copy verbatim). Thanks.
Questions: What are you seeing out there in the market?
If you liked this post, subscribe by email (or RSS). Thanks for being here.


 Skim or digest slowly.