It’s the big question right now. Will buyers put their foot back on the gas pedal or will they continue to put on the brakes? For the past couple quarters in many markets around the country buyers seemed to show some resistance to prices and back off the market a bit. So we saw more sluggish sales volume, and now we’re wondering if it’s going to continue into the new year. I have a few quick thoughts and then there’s a big monthly market update for those interested.

What will buyers do in 2019?
1) We need time: Just like a dating relationship needs time to figure out where it’s heading, we need a little space to see where the market is going to go. In the next 30-90 days especially we should get a better understanding of the direction of the market.
2) Interest rates are a band-aid: Mortgage rates are declining again and that can be a steroid to help buyers jump back into the game. During the second half of last year there was a strong negative reaction to rate hikes, so we’ll see if lower rates today can create a similarly strong positive reaction to propel buyers back into the market. But let’s remember low rates are really just a band-aid on a gaping wound. What I mean is low rates offer a temporary solution to create more sales right now without making any dent in the huge issues of a housing shortage and affordability.
3) What to watch: I have a couple quick recommendations for what to watch over the next few months. First of all, know what is normal for the spring market. What normally happens to things like sales volume, inventory, prices, days on market, etc..? Knowing what is normal can help us spot what is not normal. Secondly, I recommend keeping a close eye on listings. Is the market absorbing inventory? Are properties getting into contract? And is the number of pending sales normal or not? Remember, if pendings are anemic today, in a couple of months these properties will close escrow and show up as anemic sales volume. So by watching listings and pendings today we can get an idea of what sales might be like in a couple of months.
I hope this was interesting or helpful.
—–——– Big local monthly market update (long on purpose) —–——–
 There were two parts to the market in 2018. The first half of the year was fairly normal, but the second half definitely slumped. Here’s some things to consider right now.
DOWNLOAD 70+ graphs: Please download all graphs here as a zip file. See my sharing policy for 5 ways to share (please don’t copy verbatim).
The Camp Fire and volume: Sales volume slumped 11% these past two quarters, but December was particularly sluggish. In fact, it was the worst December in volume since 2007. Furthermore, in 20 years we’ve only seen two lower Decembers in the Sacramento Region. On one hand we figured volume would be anemic for December because it’s been more sluggish for two quarters, but then it was painfully low (25% lower). In short, if this is the actual trend, it could be a big issue if we start to see volume slump each month by 20%+. It would be a sign the market is starting to change even more dramatically. However, there could be more to the story. Let’s not forget the devastating Camp Fire in November. I mention this because in Sacramento the smoke from this tragic fire was with us for two weeks or more, and many locals stayed indoors because of the unhealthy air quality. Thus this could have led to less pending sales in November, which in turn led to less closed sales in December. I’m not saying the fire is the culprit behind our dismal December, but I think we have to at least entertain it could have been a factor to a certain extent. Yet to be fair if we see other areas of California without any fire influence show a similar dip, then I’ll be the first to say the fire didn’t have any effect. For now I think it’s okay to keep it on the table as a possibility, but at the same time let’s not blame the fire for the trend of slumping volume.
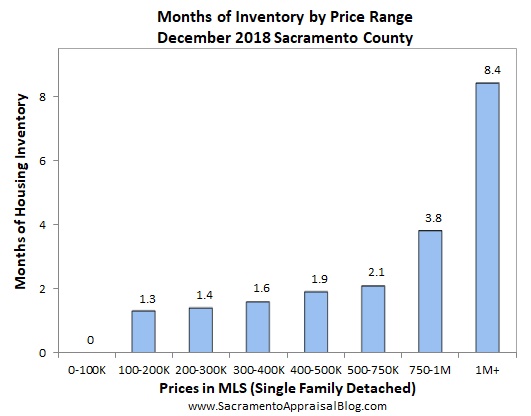
Slowing, blah, blah, blah: We’re all pretty tired of hearing words like softening, shifting, slowing, and slumping, but that’s the nature of the beast when the market changes. The trend graphs below show higher inventory, it took longer to sell these past few months, and prices sloughed as they normally do. Beyond sales volume being anemic, other metrics were fairly in line with what we’d expect to see during the fall. Though still we can easily say this fall was more dull than the past few years for sure.
Hiding behind hot annual stats: I posted some market recap images below and they’re glowing. When looking at annual stats most price metrics are up about 6-7%. Does that sound surprising since we’ve been talking so much about the market slowing? Here’s the deal. Annual stats are sexy, but when we look at the numbers over the past 3-6 months instead we see a much different trend. This just goes to show if we’re not careful we can end up hiding behind hot annual stats and missing a duller trend in front of us.
Less offers: Here’s an interesting way to see the market has changed. I know this is a bit obscure, but then again it’s a cool way to look at the market.

Momentum change: The rate of price changes has slowed lately. What I mean is in years past we’d regularly see 7-10% price increases when running stats, but over the past few months we’re starting to see only 3-6% increases instead. I talked about this recently, and fresh stats show this same trend.
Leftovers: Right now in early January we have a market of leftovers. The reality is lots of properties that didn’t sell during the fall are still on the market. Most of these homes are simply overpriced. If sellers only would’ve looked at similar sales and considered similar listings that are getting into contract it would’ve made all the difference. There are a decent number of pendings in most neighborhoods right now, but the pendings are priced right (and often in good condition).
Listen to the Listings: In case it’s useful I wrote an article in Comstock’s Magazine this month to talk about the importance of giving strong weight to listings. It’s not just about the sales.
I could write more, but let’s get visual instead.
BIG QUESTIONS:
1) 2018 RECAP: What did the market do last year? Here’s some recap images.


2) LAST YEAR VS THIS YEAR:


NOTE: Placer County had very few sales this December, so I wouldn’t put much weight at all on the price figures for this month. The median price actually increased quite a bit from November to December. My advice? Don’t read anything into this.
3) SALES VOLUME: It’s important to look at sales volume in a few ways to get the bigger picture. Here it is by month, quarter, and year. As an FYI, volume was down 11% during the second half of the year in the region.
SACRAMENTO COUNTY:
Key Stats:
- December volume down 24.9%
- 2018 volume down 3.4% (entire year)

SACRAMENTO REGION VOLUME:
Key Stats:
- December volume down 24.8%
- 2018 volume down 4.8% (entire year)

PLACER COUNTY VOLUME:
Key Stats:
- December volume down 19%
- 2018 volume down 6.9% (entire year)

4) SLOWING MOMENTUM: The stats show the market is slowing down when we look at the rate of change by year. Looking at monthly, quarterly, and annual numbers helps give a balanced view of things.


SACRAMENTO COUNTY (more graphs here):


SACRAMENTO REGION (more graphs here):


PLACER COUNTY (more graphs here):


I hope that was helpful.
DOWNLOAD 70+ graphs: Please download all graphs here as a zip file. See my sharing policy for 5 ways to share (please don’t copy verbatim).
Questions: Do you think buyers are going to put their foot on the gas pedal or brake pedal in early 2019? What do you see happening in the market right now?
If you liked this post, subscribe by email (or RSS). Thanks for being here.