We’ve been waiting for the Fed to cut rates, and it FINALLY happened today. That’s positive news, but let’s unpack what that means. Also, let’s talk about the problem of days on market. Any thoughts?

UPCOMING SPEAKING GIGS:
10/18/24 Prime Real Estate (private)
10/23/24 SAFE Credit Union (details TBA)
10/29/24 Orangevale MLS Meeting
11/19/24 Downtown Regional MLS Meeting Q&A 9am

THE FED CUT vs MORTGAGE RATES
I think some buyers and sellers are excited to hear that the Fed finally cut rates this week, BUT the Fed didn’t cut mortgage rates. The cut to the Fed Funds Rate is for things like credit cards and auto payments. Keep in mind actual mortgage rates have already dipped in anticipation of the Fed cutting, so don’t expect mortgage rates to fall 0.5% immediately.
GEN Z TRANSLATION (sorry)
I ran the paragraph through a Gen Z translator: Okay, so some peeps are hyped that the Fed finally slashed rates this week, BUT like, they didn’t touch mortgage rates. The Fed Funds Rate drop is mainly for credit cards and car payments. Just a heads up, mortgage rates already dropped a bit in anticipation of this, so don’t expect them to fall by 0.5% overnight, fam.
LET’S COMPARE THESE TWO RATES
I hope this graph will be useful. And if you’re confused, talk to your favorite loan officer to help clarify. In short, the Fed cut the orange (not the black). And now let’s keep watching what actual mortgage rates do.

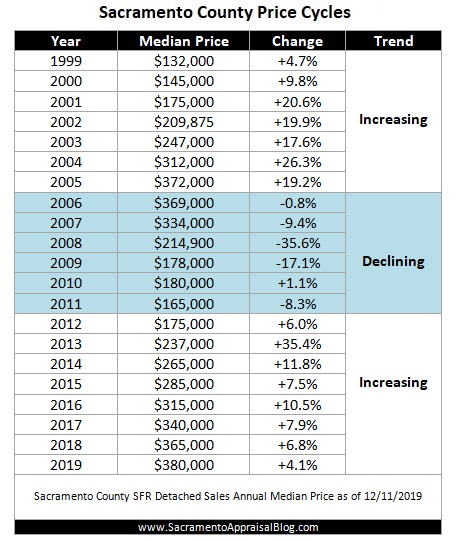
“THE SLOW DANCE SINCE 1971”
And while we’re on the subject of rates, here’s the 10-year treasury yield, which has a very close relationship with the 30-year fixed mortgage rate. Check out the twinning for these two lines. This is why so many people who watch mortgage rates pay such close attention to the 10-year yield. As Logan Mohtashami would say, it’s been a “slow dance since 1971” between the 30-year mortgage rate and 10-year treasury.

2024 VIBES ARE NOT 2021 VIBES
I think this meme says it all. It’s just going to take longer to sell today. Is that what you’re seeing in the market? Please keep sharing perspective.

YOU AREN’T THE PROBLEM (HOPEFULLY)
“I’m glad it’s not just me.” I heard that a few times this week after pushing out some stats for days on market. A few agents reached out to say it was nice to see other people have listings on the market for 60+ days too. Yeah, you’re not alone because MANY properties are taking much longer to get into contract. Friends, it’s not 2021 any longer where stuff is selling in lightning speed, so we need to keep adjusting expectations. Check out the disparity between listings and sales though. My advice? Figure out what it takes to be a sale instead of a stale listing. Look to the neighborhood comps to understand the dynamics of why buyers are moving quickly or avoiding listings. And sellers, price accordingly. Don’t get stuck in the past like Uncle Rico.

THE MARKET IS DIFFERENT BY LOCATION
I think this really brings home the point that the market is NOT the same in every location. Remember, it takes longer to sell in some areas, and some of that is due to higher prices needing more time on the market. On that note, don’t expect Sacramento County dynamics when listing in Placer County. Know what I’m saying?


BUT SOME PROPERTIES ARE SELLING QUICKLY
Here’s median days on market, which represents what half the market has done in September (average is higher). So, we see an average of 25 days on market for closed sales in Sacramento County, but the median is only 13 days. On one hand, we really want to know properties are taking almost four weeks to get into contract on average. Yet, half the market got into contract in slightly less than two weeks (median). Both of these stats are valuable.


TARGETING THE MEDIAN?
The market has a “weird” vibe like I talked about last week because some stuff is going very quickly while other properties sit. My advice is for sellers to aim for median days on market where possible. What do you think of that? The median stats below represent what literally half of all properties have done in September. In my mind, this is a great target to sell within this timeframe instead of overpricing and enduring multiple price drops. Of course, higher-priced homes could easily need more time on the market, so don’t be rigid about the overall median here. And some properties moving quickly have a condition and location advantage, which is why they’re selling fast. Yet, price tends to be able to solve everything, so pricing reasonably is the key. In other words, buyers are often turned off by cosmetic fixers today, so don’t price a fixer like it’s updated or even average.

THE COMMENT POLICE: I have a captcha on comments now since I got 16,000 spam comments during ten weeks away, and this is helping me solve the issue. I really don’t like that it asks people to do a math problem, but it’s my solution so far. Hang in here with me.
I hope this was interesting or helpful.
Questions: What are you hearing from consumers about rates? What stands out to you about the stats? I’d love to hear your take.
If you liked this post, subscribe by email (or RSS). Thanks for being here.