It feels like chaos out there. The housing market is on steroids and it’s mind-blowing to see such rapid growth lately. Today I want to unpack ten things I’m watching in today’s market. For my out-of-area readers, I’m guessing you are probably seeing the same trends. But please let me know. What is similar or different in your area?

MARKET UPDATE PRESENTATION: I’m giving a big presentation next week by Zoom for SAFE Credit Union. It’s free and you are invited to sign up here. It could be useful for background noise while working. Hope to see you there.
10 THINGS TO KNOW ABOUT THE MARKET
Skim or read in depth. The following post is organized around ten points.
1) PRICES ARE INSANE:
We’ve seen enormous price increases lately. It’s mind-blowing to see 20% increases because the market really was slowing down in recent years. Also, the median price in the region is up nearly 9% from two months ago in January.


Here’s a different way to look at prices. The orange line represents 2021. It’s an outlier market, right?

2) BUYERS MADE TWICE AS MANY OFFERS LAST MONTH:
Buyers made twice as many offers last month compared to the previous year. These figures are based on closed sales and MLS data.


3) MORE BUYERS ARE OFFERING 5-10% ABOVE THE ORIGINAL PRICE:
Here’s a look at what buyers are paying right now in relation to the original list price. One of the glowing stats is we’ve seen about five times as many buyers paying 5-10% above the original list price this year. Wild times, right? Of course only six percent of sales sold below the original list price last month too, which reminds us very few properties are overpriced. Yet nearly one in five sales sold at the original list price. I know, that almost seems like an error, but it’s really not because take a look at last year which represents what should be happening. As you can see if we were having a normal year we’d probably be seeing about half of all sales selling at the original list price.
Takeaway: Be cautious about saying everything is selling 20% above the list price. The stats don’t support that claim.


4) HOUSING SUPPLY HAS BEEN CHOPPED IN HALF:
I feel like a broken record. Housing supply is about half of what it was last year. The truth is we have weeks of listings and months of buyers.


5) SALES VOLUME HAS BEEN UP FOR TEN MONTHS IN A ROW:
There aren’t enough listings out there to satisfy demand, but for ten months in a row buyers have been buying basically everything, which means we’ve been able to surpass numbers from last year. Some people don’t believe it when I tell them this, but it’s the truth. In short, it is not easy out there, but buyers are getting it done.


NOTE: I have images like these for Placer, El Dorado, and Sacramento County too. Send me an email if you need something.
6) MORE LISTINGS ARE FINALLY COMING:
We are starting to see more listings hit the market. It really is a normal seasonal amount so far, so it’s nothing to write home over, BUT during a pandemic anything that feels close to normal is something we covet. Granted, there are not enough listings to satisfy crazy demand yet or slow down the market, but at the least we’ve seen more lately.
Mortgage applications drop: Speaking of shopping for homes, for three weeks in a row we’ve seen mortgage applications drop. This seems to be a reflection of rising rates and prices lately and it’s one small metric to watch to get a sense of demand in the market.

7) THE REST OF THE COUNTRY FEELS LIKE SACRAMENTO:
I love this image from Altos Research because it helps show depleted inventory is something happening across the entire country. This is a good reminder because it’s tempting for locals to blame the aggressive market on Bay Area buyers when in fact many markets feel just like this. I’m not diminishing the reality of what seems like increased Bay Area migration, but let’s not forget we’re seeing an ultra-competitive market almost everywhere due to crazy low rates and anemic housing supply during the pandemic.

8) IT’S NOT A DISTRESSED MARKET:
There is so much talk about a coming foreclosure wave, but for now it doesn’t look like there is one on the horizon as forbearance rates are heading in the right direction. We are still in the thick of the pandemic of course, so we are certainly not out of the woods. All I’m saying is I’d recommend being cautious about embracing a doom and gloom narrative because so far the stats don’t support this idea. Let’s stay tuned though. And for the record I will be the first to change my narrative if the stats change… In terms of distressed sales at the moment, we really have bottomed out. It’s hard to get too much lower than 0.39% of sales being bank-owned and 0.30% of sales being short sales.

9) HUGE GROWTH AT THE TOP:
The market is very much top heavy right now. What I mean is we’ve seen explosive growth at higher prices – especially above $1M. This is a dynamic being mirrored in many markets across the country too.
BIG TAKEAWAY: When talking about price stats being 20% higher it’s important to realize some of that growth has to do with the types of homes selling. In short, less at the bottom and more at the top naturally elevates price stats.


10) CONVENTIONAL IS MORE DOMINANT THAN CASH:
The narrative is that cash buyers are gutting the market, but it’s not technically true. Cash really isn’t king these days because it’s so cheap to borrow money. Locally we’re seeing 7 out of 10 sales go conventional. BUT cash is absolutely winning when conventional buyers can bridge the appraisal gap and offer other incentives to the seller. It’s not so easy to get an FHA offer accepted either, but at least 1 out of 10 sales were FHA last quarter.


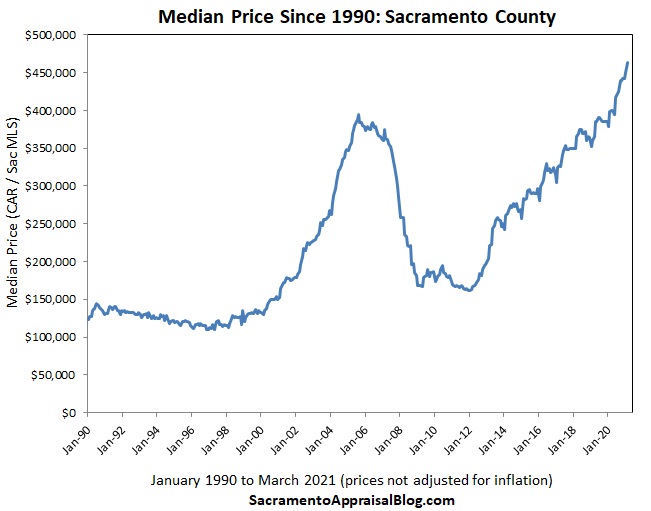
BONUS: Here are two visuals to show what the median price looks like over the past few decades. In one visual I adjusted for inflation too (which can be an important consideration when comparing today with 2005). Here are some thoughts on how long this market can keep going.

Other visuals: Not that you needed more, but check out my social media in coming days and weeks for extra visuals and commentary. I am posting daily stuff on Facebook, Twitter, and LinkedIn. Oh, and sometimes Instagram.
Thanks for being here.
Questions: What stands out to you about the market lately? I’d love to hear your take.
If you liked this post, subscribe by email (or RSS). Thanks for being here.
Ryan, insane is the perfect description for this market. I wouldn’t want to be a buyer today.
I see the same craziness in Tampa Bay.
Thank you Jana. I feel similar about being a buyer. It has to be so incredibly stressful (hang in there buyers). It’s wild to see this type of insanity hitting so many areas at once. Thanks for the scoop on your area. I appreciate it.
I would not want to be a buyer in this market and with these “highest and best offers”, I definitely would not make the decision to pay more for a house than its worth. I feel buyers who are falling into that trap are setting themselves up for financial failure down the road. If there is going to be a foreclosure wave, I will wait to buy then. Love the charts….I have recreated some to use in my reports.
Thanks Laryssa. Yeah, I feel for buyers these days. The struggle is an offer that isn’t aggressive on price just isn’t competitive. The really lopsided part in my mind is the removal of various contingencies.
So good to hear about the charts.
Great analysis Ryan. We are looking overall pretty similar here in Portland in terms of low inventory, bidding wars, and how volume compares to last year, but our price growth seems more modest by comparison.
Interesting. Thanks so much Gary. I always like to hear about Portland.
Very Good stuff, Ryan. On the conventional loan numbers is there an estimate on the LTV- the myth is everyone is putting 20% or more down and they have 810 credit scores.
I like hearing when the first time buyer wins an offer.
Thanks Bruce. I wish I had stats like that. I doubt everyone is putting down 20% and then covering the appraisal gap. That’s some serious cash. I think in many cases buyers are having to juggle their finances too. So maybe they start with a certain amount down and then switch things up if an appraisal comes in lower. If you hear anything definitive, I’m open ears. I would bet Freddie Mac has some stats on this actually.
New buyer here. Market is bananas. Just got my 8th offer accepted. 5% down (810 credit score), waived appraisal, and offered $22K over asking.
Ok-ish neighborhood, has been a rental for a long time so most maintenance has been deferred, needs new AC, plumbing/leaking/moisture issues, some dry-rot, floor were done cheaply and have gaps in some spots, etc.
If the seller doesn’t want to budge on price for the most important things like AC and plumbing repairs, I’ll probably be walking away from the deal. Sigh.
Hi Millie. Thanks for chiming in. I really appreciate the details and congratulations on getting an offer accepted. Not bad after 8 (so crazy to say that). I think your comment is important too because it shows buyers are not throwing all reason out the window. Buyers want to negotiate as much as the market will allow. Hang in there and fingers crossed things go well for you.
Ryan, always on point and soooo helpful. This particular post was a great way to compare the actual statistical data with the hype and headlines. I have forwarded it to many of my clients and encouraged them to follow you. It has really been a test of my real estate chops to get my first time homebuyers’ offers accepted and get them into contract. Knowing the market and stats (aided immensely by your contributions) has really been key for me and my buyers – it helps them feel confident when we are crafting offers. Within reason, my clients have waived appraisal or inspection, offered appraisal gaps and free rent backs, and offered over asking. Developing a relationship of trust and credibility with the sellers’ agents has been clutch as well. I have only run into one that didn’t appraise at value that I believed should have. As always, a huge thank you!
Thank you Alice. I appreciate hearing that. I was actually just thinking about you as I saw a sale with your name on it last night when pulling comps. Haha. I think onlookers can easily judge buyers offering over asking price right now, but it’s really one of the only ways to get things done today. I feel for buyers having to shop in such a chaotic market. Hopefully soon we’ll see a slightly less chaotic experience with more listings and maybe demand softening a bit. We’ll see. I concur about building good relationships with agents on the other side. That’s a game-changer. Hands-down.
Fantastic summary, Ryan. I really appreciate your work. I’ve been coming around to the idea that the market imbalance is more about demand than supply — I had thought that fewer people were listing because of COVID and not wanting strangers going through their home (coupled with a surge in demand), but when I see that total sales for the past year are similar to previous years, I realize it’s really pretty much about demand. A combination of pandemic-related moves (upgrading to have a home office or a backyard, leaving the Bay, etc.) millennials aging into homeownership, and the cyclical surge of low rates boosting demand. What do you think?
Thanks Steve. I always appreciate your take. I think we’ve been hyper-focused on supply that we haven’t adequately talked through big issue of demand. But it’s really both here. We definitively have fewer listings, but we do have more buyers playing the market. There is usually an excess amount of listings to a certain extent, but we just don’t have any excess right now. Millennials are now the largest generation and it’s a big deal having them at a ripe age for home ownership and family building. The phrase “Silver Tsunami” is one to follow too regarding Boomers…
I was thinking something very similar to Steve Kroes. If we have more sales this year compared to last year it seems to me that we have more supply and the demand is just greatly outstripping it.
It is still a Supply and Demand issues, but given that March had 11% more sales but 120% more offers than last year it seems like the issue is really on the demand side instead of the supply side. Even looking back to 2008 we average 25,000 to 29,000 sales per year and 2020 was pretty typical at 27,527 so pretty much in the middle.
Thanks Nathan. Yeah, one of the things we are tending to downplay is the power low rates have played in creating truly excessive demand. We definitively have fewer listings for certain, but we also have demand on steroids. I would say it’s both, but one of the huge issues why the market feels so imbalanced is because of excessive demand. I think at times people are surprised to see our volume is increasing. It makes total sense with the way the numbers work and I may have to do a video on that to explain it. Ultimately this idea doesn’t fit in with some of the narrow narratives out there that give laser focus to supply alone. Thus to me this underscores how important it is for our narrative to be formed by actual data….
Do we actually have fewer listings or is it just that with the high demand and 6 median days on market we have fewer Active listings?
How many new listings did we have YTD compared to past years for the same time frames?
I don’t have time to do exhaustive research this very moment, but a few things:
1) Check out Trendgraphix and watch the new listings. There was a huge difference noted last year as soon as the pandemic happened. In fact, look at the visual under #6 in my post. You can see there was an initial dip where listings sloughed for a month or so and then they saw an uptick. We just never got to normal levels. So the narrative about fewer listings is legit.
2) Right now the number of listings on Thursday and Friday have been more normal these past few weeks. I used to watch listings every day, but I stopped doing that for a number of reasons.
3) I pull listing data typically once a month as a snapshot and the number of active listings is WAY down. But part of the issue here is we have way more pending contracts, which naturally deflates the number of active listings. In other words, there are fewer active listings because more people are in contract. So we have to think beyond just the number of active listings. The number of technical active listings is down significantly though. I typically share stats like that on the 1st of each month when I make graphs. I don’t have those stats handy at the moment, but I recall this month it was something like 1,200 active listings as opposed to well over twice that number in a normal market. Yesterday when looking though there were clearly a couple hundred more listings compared with just a couple weeks ago.
4) Look at the chart in #6 and you can see there is normally a gap between new listings in blue and pendings in red. Well, we haven’t really had a gap over the past nine months or so. This tells us buyers are pulling the trigger on everything in sight. This basically explains why the market is so aggressive because we don’t have a normal amount of space between the number of listings and pendings.
In short, we do have fewer listings, but it’s starting to normalize. I’d still say this is both an issue with supply and an issue with demand. I just the demand part of the equation has not been embraced much unfortunately.
I love all the sporting info, but this craziness is just the lack of supply, and most of the Demand (Buyers) still able to qualify for these increasing prices due to low interest rates,
example of what SUPPLY & DEMAND can look like when it’s on steroids
Thanks Rick. Buyers are getting it done. Such low rates really have afforded buyers opportunities. At some point the value of low rates is diminished by higher prices, but I don’t think we’ve hit any sort of big inflection point yet. We have seen a few weeks of lower mortgage applications. Though that could change if rates tick down again. Let’s keep watching….
St. Petersburg FL: four years ago we were Florida’s most affordable small city near water. Now, teardown shacks a block from a 4-lane interstate that were on the market for around $35k are getting the cheapest of cheap flips & selling for $350k. I know people who just bought one. The rental market is so tight that monthly expenses even at that price are lower than any comparable rental, and also the reverse: market rate rent would easily cover payment + expenses if owners wanted to move … & it’s hard for me to consider property at these prices a great investment.
Thank you Amy. It’s wild to see how much prices have changed. And for any onlookers, this is exactly what I am talking about. The dynamics happening in Sacramento are showing up in many other places throughout the country.
Fascinating info, as always! THANK YOU!!!!
My pleasure. Thanks Leah.
My wife and I are in our mid 30s, first-time homebuyers (baby on the way, plus needing space for WFH). We just submitted an offer for a place in Tahoe Park, about 2.5% over asking price. It was declined due to competition from a full cash offer that waived contingencies and closed in 21 days.
Fast forward, the agent calls us to say that cash offer fell through (how?) and ours is back in. We’re in contract, and my head is going to explode. Up is down, left is right, time is a flat circle.
Nick, that is awesome news. You know, I have no idea what happened here, but a cash offer really isn’t the silver bullet to closing escrow. We really only saw about 13% of sales go all cash this past quarter. I’ve been hearing of buyers getting offers accepted as cash supposedly, but then they end up surprising everyone by getting a loan. It’s like a bait and switch thing. Who knows what happened here, but we are clearly living in the Upside Down (Stranger Things). Congrats to you and your growing family. Tahoe Park is a great neighborhood.
Thanks! Yup, totally bonkers.
Can’t argue with that. Thanks Nick.