What are prices doing? That’s always the question, and I get it. But there are bigger fish to fry to understand what the housing market is doing.

Market webinar: On Thursday May 19th at 10am I’ll be doing a deep market update webinar through SAR to talk about the latest trends. We’ll have an hour, so we can go over a ton of stuff. Sign up here.
A shift: Over the past few weeks there has been a shift in demand, which is why this conversation is so important. This isn’t about doom and gloom. I’m just saying we need to look at other things besides prices.
The last time: Let’s look at what happened when the market changed in 2005. There’s some helpful insight here, even though what happened last time isn’t the new template for every future correction.
WHY PRICES ARE THE LAST PLACE TO LOOK
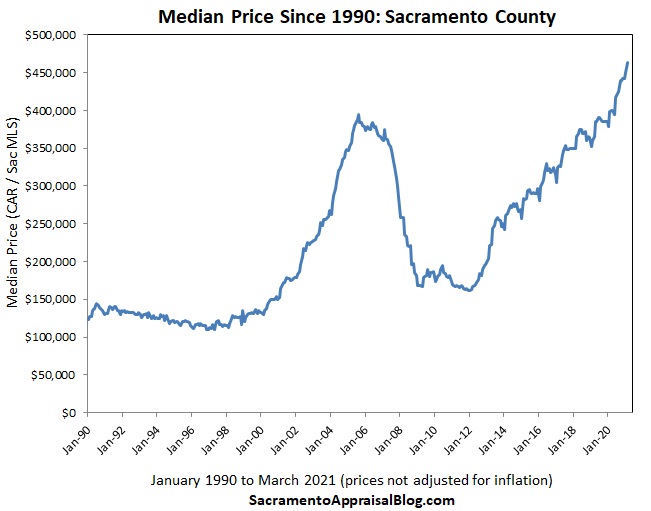
Not that much different: The real estate bubble burst in Sacramento County in August 2005, but prices were only down 4-6% during that first year. When thinking of a pop, that doesn’t sound like much, right?

TWO THINGS TO WATCH INSTEAD:
The real story was volume: Prices saw a modest dip, but sales volume was imploding. There was a 43% change in the number of sales between August 2005 and August 2006. Some could’ve said, “Meh, prices are only down slightly,” but the glaring issue was nine hundred fewer sales in August 2006 compared to August 2005.

The real story was supply: Prices dipped slightly, but housing supply increased by 207% in the background. In other words, housing inventory went from 2.6 months to 8.0 months the next summer. And this helped set the stage for a massive collapse in 2007.

THE BIG POINT:
Prices were about the last place to look to understand the trend at the time. The real story was seen when looking at listings and volume.
What to watch: If you want to see what the housing market is doing, I suggest giving strong attention to the number of listings, the number of weekly pending contracts, and the number of sales. There are many other things to watch, but are buyers willing to continue to play the market? That’s the big question, and we’ll see the answer in volume before prices. Of course, if you want to sound suave on date night, watch other things like price reductions, the number of offers, days on market, etc… I’m talking through lots of these things every week. If you’re not local, check out the Redfin Data Center for weekly stats.
Whatever you do, don’t get stuck on prices alone.
Getting buyers to walk: As I said last week, price growth slowed in April compared to truly exuberant gains between January and March. Today we are seeing slow traffic in general at open houses, more price reductions, and buyers having an easier time getting offers accepted (not always). This really happened quickly too over the past few weeks. Overall, buyers are far more sensitive to price, condition, and location, which means sellers need to be open to negotiation. I’ve heard a few examples of buyers walking after sellers said, “Yo, Bestie, thanks for the offer. Now give me $25K more and remove the appraisal contingency.” That might have worked in January, but this is May. It’s a different market today. I’m also hearing more examples of, “We priced it right, but we aren’t getting any action yet.”
Embracing stats: The other day someone wasn’t happy because I wouldn’t call this dynamic the start of a market correction, but the truth is we need time and stats to understand the longer-term trend. This is not me sugarcoating. This is me being objective. Let’s keep watching the numbers (by the week) and letting the stats form our narrative.
MARKET STATS: I’ll have lots of market stats out this week on my social channels, so watch Twitter, Instagram, LinkedIn, and Facebook.
Thanks for being here.
Questions: What stands out to you most in this post? What did I miss? I’d love to hear your take.
If you liked this post, subscribe by email (or RSS). Thanks for being here.


 THE SHORT VERSION:


 Two ways to read the BIG POST:


