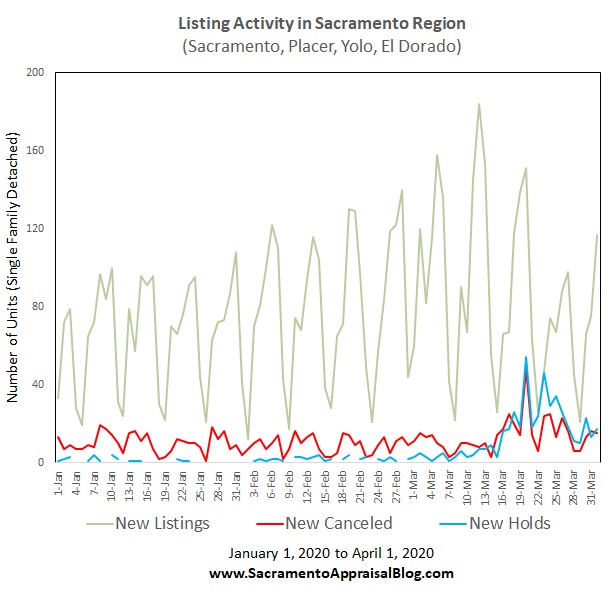
I can see the headlines now. “Prices rose despite the coronavirus,” or “The housing market shows strength in March despite the pandemic.” But let’s step back and think critically about glowing stats from March and what they really tell us. I hope this will be helpful. Any thoughts?

Five things to consider about stats during the pandemic:
1) Prices rose last month (technically): If we’re not careful the hot headline can be the median price rose 3.5% last month in the Sacramento region despite the pandemic. In other words, the median price increased from $425,000 in February to $440,000 in March. On paper it looks like the market is fine and moving along without any effect. BUT we have to remember prices in March actually reflect pending contracts from mostly January and February. So sales in March actually tell us way more about previous months rather than March itself. If you don’t believe me, only 2.9% of all sales in March got into contract on or after March 12th (the day we found out Tom Hanks had coronavirus) and only fifteen properties have gotten into contract and closed since the lockdown went into place. So we have very little pandemic data to consider within March sales.
2) Pulling stats too soon: This sounds geeky, but it’s key to understand. Pulling sales stats on the first of the month is way too early because not all sales have been entered into MLS yet. In my experience on the first of the month we’re still missing about ten percent of the sales from March because not all sales have been entered into the system yet. So if we wait about a week instead to pull stats we end up getting a much more accurate picture. I quoted the median price above at $440,000, but that is preliminary and it could easily change based on ten percent of the market not being accounted for yet.
3) What to watch right now: If you want to see the current market, watch what is happening in the listings and pendings rather than recent sales in March. Are listings moving or sitting? Are we seeing more price reductions? Are properties spending less or more time on the market? What is the sentiment among buyers and sellers? Who is gaining or losing power? Has there been a change to the number of listings and pendings? Do sellers have to give more credits to buyers? Are contracts getting bid up? Are contracts falling apart more often? We need to ask these questions in every neighborhood and price range. My advice? Look to neighborhood stats and let the numbers inform your narrative about what is happening in the market.
4) Be objective about data: I find it’s so critical to be objective about prices. What I’m saying is if we’re not careful we can judge a market’s price direction based on what we think should be happening, recent sensational headlines, or even regional trends for pending contracts rather than looking to actual stats in a neighborhood or price range. Appraisers even need to do this. It can be tempting to say prices are declining, but we need to be sure that is the case based on what we are observing in the neighborhood market. Remember, it’s possible to be see pendings and listings start to slough, but that doesn’t always mean we’re seeing price declines at the moment. Could that be coming soon? Yes. But we need to let the data tell the story. Let’s remember the market is changing quickly, so what we’re saying today might be different tomorrow.
5) Upping your numbers game: If you work in real estate I can’t emphasize enough how important it is to be fluent in market trends and to be able to talk through current dynamics so you can offer informed real estate advice. If it’s helpful, I am posting a few YouTube videos each week right now as well as lots of content on Facebook and Twitter. Or let’s set up a Zoom meeting with your office so we can talk shop (local offices are free). My goal is to offer perspective and objectively share the story of the market without sensationalism.
A few closing things:
New market update video: Here is a new market update video from two days ago. This is 15 minutes. Watch below or here. I have some new stuff to share, so be on the lookout hopefully today.
Fresh daily visuals: During this pandemic I’ve upped my stats game and I’m finding new ways to visualize how the market is moving. I’m not focusing on prices for now because we don’t have enough data yet.


Side note for appraisers: There are disclaimers being put into appraisal reports that talk about not being able to quantify the long-term or short-term effect of coronavirus, but if we pay close attention we likely have enough data right now to at least talk about some of the short-term dynamics. It’s easy to put boilerplate pandemic comments in an addendum for liability and that’s a really good idea, but what’s even better is our market analysis. Colleagues, would it help to have some tutorials for these types of graphs so you can make them in your market? If there is enough interest I’d be glad to put something together. Let me know.
I hope this was interesting or helpful. Thanks for being here.
Questions: What stood out to you about this post? What are you seeing out there in the market right now?
If you liked this post, subscribe by email (or RSS). Thanks for being here.