The housing market is slowing and today I want to share seven quick ways I’m seeing that. But here’s the thing. This market is still driving at warp speed. In short, the market is slowing, but it’s not slow.

 Podcast with Golden 1 Credit Union: If you need some background noise, here’s a podcast I recorded recently. I had fun with this one. Listen here.
This post is designed to skim or digest slowly.
7 WAYS THE MARKET IS SLOWING:
The housing market is still so competitive, but there are subtle ways I’m seeing slowing. This is so important for sellers to understand – not to mention real estate professionals who are talking with clients and the public. If you’re not local, what are you seeing in your area?
1) Taking longer to sell: Last month on average it took 12 days to sell a home and 6 median days. Since June pendings have taken two extra days to get into contract. This is still lightning fast, but it’s slower than it was.
2) More homes are selling below the list price: There are slightly more homes selling at or below the list price right now. Here’s a visual to show what buyers are paying compared to the asking price. As you can see most categories slowed slightly last month, but not every category.


3) Fewer multiple offers: For two months in a row we’ve seen fewer multiple offers in the Sacramento region. Keep in mind the percentage of offers is still about as high as it’s ever been.

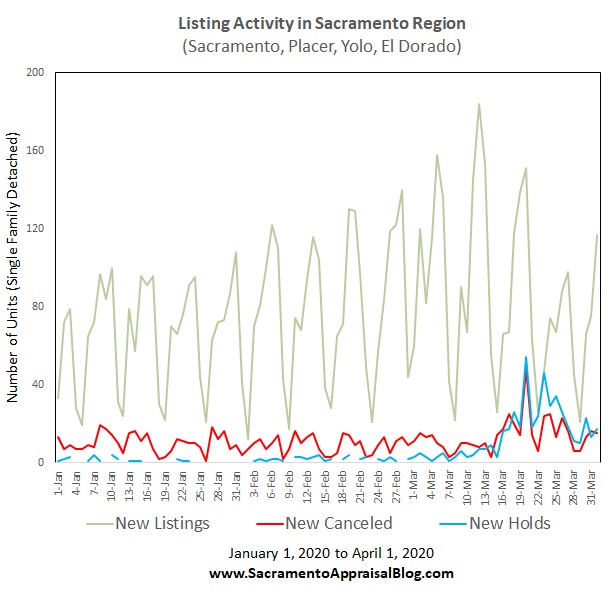
4) More listings are hitting the market: We still don’t have enough listings to satisfy demand, but there are now literally multiple hundreds of extra listings on any given day in the Sacramento region compared to a few months ago.

5) Slightly higher monthly inventory: We are seeing a slight uptick in monthly housing inventory. Very slight. It’s wild to say this when we basically still have half-a-month of homes for sale, but supply is up just a little in most counties from a few months ago. Of course now we are seeing mortgage rates at their lowest point in months, so we’ll see what happens to supply in coming time.

6) We hit the big home peak: The dark blue line represents the average home size in Sacramento and it goes up and down like clockwork each year. Do you see how size typically hits a seasonal peak during May or June (besides last year)? Anyway, the average size slumped in June, which is what we’d expect to see in a normal year. This goes to show we’re seeing some normal seasonality.

7) Word on the street: I’m hearing from lots of real estate agents, loan officers, and appraisers that they’ve seen a slightly slower vibe. I haven’t heard anyone say the market is slow, but there is lots of chatter about slowing. At the same time I’m hearing things like, “My listing had 23 offers” or “We got outbid again,” which speaks to how competitive it is right now.
8) Other: What is number eight?
Any thoughts?
3 WAYS THE MARKET IS NOT SLOWING:
1) Record prices: The market still has upward price pressure in lots of areas and each month we’re seeing old price records shattered (nominal prices not adjusted for inflation). See stats below for specific price metrics.

2) Buyers paying big money over asking: On average properties sold $25,865 above their original list price last month. This is a wild stat considering it represents over 2,800 sales. This figure is higher than any of the previous three months too, which shows the market is still bananas. By the way, the average amount clearly does not perfectly represent every individual escrow.
3) Record sales price to list price ratio: Last month properties on average sold 4.1% above their original list price. This might seem low, but it’s actually higher than it’s ever been. This is a good reminder that not every stat is showing slowness. In other words, when a market slows we don’t always see it in every single metric. Of course it’s good to keep in mind sales in June really represent pending contracts from May more than anything.

Okay, two last thoughts.
NOT CRASHING: The doom and gloom crowd loves to look at slowness and say the market is starting to crash, but that’s what they say every year when stats sag. Look, I’m not saying the market is perfect. I’m just saying stats right now don’t support a crash and burn narrative.
IT LOOKS SEASONAL EH: In a normal year we’d expect for the housing market to crest around this time and begin a seasonal descent for the rest of the year. So it’s no surprise to see the market slowing right now.
——————– BIG MARKET UPDATE ——————–
 For those interested, here’s a big Sacramento market update:
THE SHORT VERSION:
Here is a highlight reel to talk through some of the bigger themes right now. In short, the stats are sensational and we are in the midst of an incredibly competitive market. But we’re also seeing some slowing. Both things are true at the same time.

THE LONG VERSION:
Stats are on steroids and we are still seeing one the wildest markets we’ve had. It’s just some metrics are showing some symptoms of what looks like seasonal slowing. Here are some of the bigger themes.
FORECLOSURES HAVE NOT INCREASED:
Some folks are talking about an increase of foreclosures, but that hasn’t been happening. What I mean is these properties are definitely not showing up on MLS. I keep hearing of a coming foreclosure wave also due to forbearance rates, but those keep going down.

MAY TO JUNE PRICE STATS INCREASED (NOT A SHOCKER):
How has the market changed recently? Take a look at May to June prices. In short, every metric in all surrounding counties showed an increase last month.


LAST YEAR VS THIS YEAR:
Last year the market was dull at the beginning of the pandemic, so this year versus last year gets a little weird for a comparison. My advice? Take these percentages with a grain of salt because they’re inflated due to sagging numbers last year. And remember these percentages DO NOT actually mean every house is worth that much more either.


MORE PRICE VISUALS:
A few more visuals to show the insanity of price growth lately. Look how far disconnected 2021 prices are from previous years.


SALES VOLUME HAS BEEN STRONG:
For thirteen months in a row we’ve seen higher monthly sales volume compared to the previous year. This June was up from the previous two years and overall at a fairly normal level. Frankly it’s impressive to see this many sales in light of having such low supply. It just goes to show buyers have been getting it done. Keep in mind last year did have lower volume due to two lower months at the beginning of the pandemic, so that’s one reason why the percentages are up so much this year. But we’ve also seen increased migration this year too, particularly in El Dorado and Placer County.


Anyway, this is getting really long.
MARKET STATS: I’ll have lots of market stats out this week on my social channels, so watch Twitter, Instagram, LinkedIn, and Facebook.
Thanks for being here.
SHARING POLICY: I welcome you to share some of these images on your social channels or in a newsletter. In case it helps, here are 6 ways to share my content (not copy verbatim). Thanks.
Questions: What are you seeing out there in the market? What are you hearing buyers and sellers say? I’d love to hear your take.
If you liked this post, subscribe by email (or RSS). Thanks for being here.


 The market is often dull during the fall, but that’s not the case this year. I mean, we’re definitely seeing slightly lower prices, it’s taking longer to sell, and sales volume is sloughing, so clearly the signs of a slower market are here. Yet this fall season isn’t really incredibly slow or painfully dull either.


