• Skip to primary navigation
  • Skip to main content
  • Skip to primary sidebar

Sacramento Appraisal Blog | Real Estate Appraiser

Real estate appraisals for divorce, estate settlement, loans, property tax appeal, pre-listing and more. We cover Sacramento, Placer and Yolo County. We're professional, courteous and timely.

  • About
  • Appraisals
  • Order
  • Ask Ryan
  • Areas
  • Classes
  • Press
  • Trends
  • Share
  • Contact

softening prices

Is it just me or is the market slowing?

November 12, 2018 By Ryan Lundquist 24 Comments

The market is slowing. We’ve been hearing that all over the place lately and it’s been a common clickable headline. But it’s not just hype because there’s some truth to it. Today I want to show this reality with a few visuals, mention three takeaways, and unpack a huge Sacramento market update for those interested. I hope this is helpful – whether you’re local or not.

Tighter Prices: Is the market slowing? How would you show that? Take a look at the rate of price changes in the images below and let me know what you see.

OCTOBER:

PAST 90 DAYS:

ENTIRE YEAR:

TAKEAWAYS:

1) Slowing: Prices are still up, but they’re not up by as much this year. What I mean is in years past we’d regularly see 7-10% price increases when running stats, but over the past few months we’re starting to see 4-6% increases instead. This helps show the market as a whole is slowing.

2) Dull fall & critical thinking: Stats have begun to change more significantly these past few months since a slower feel hit the market. A few months back sales volume dipped, but now after multiple months of lower volume this is becoming a trend (at least for the fall). As we watch this unfold and see that prices are much tighter together as I showed in the charts above, let’s consider two things: 1) Price stats today are more subdued in light of a much duller fall season (duh); and 2) Last year’s fall season ended up being a little more flat than usual, so higher prices from then could be helping this year’s numbers appear a little more depressed. I know, it sounds like I’m trying to soften the idea of the market slowing, but that’s not it at all. I’m thinking critically through the numbers and explaining in part why they are the way they are. Ultimately I find myself interpreting these numbers cautiously, and I think we need to get beyond this fall to see the bigger picture of what the numbers show us and where the trend is going to go.

3) Wide & narrow view: I chose to share stats in three ways on purpose to show something important. Did you notice a difference in the price change depending on how wide or narrow the dates were – whether 30 days, 90 days, or 12 months? Basically the more data we considered, the tighter the price gap was. This is a good reminder to look at the market in different ways to try to discern the trend. It’s also a good reminder to be careful of pulling older data because sometimes that can mask a trend that is happening right now.

The future: Naturally when hearing about momentum slowing in a market it’s easy to start predicting the future as we see price gaps tighten. Many say the market is going to crash, others say it will correct by 10%, and some say it will level off and progress into a state of balance. All three of these ideas have one thing in common. They’re guesses.

I hope that was helpful.

—–——– Big local monthly market update (long on purpose) —–——–

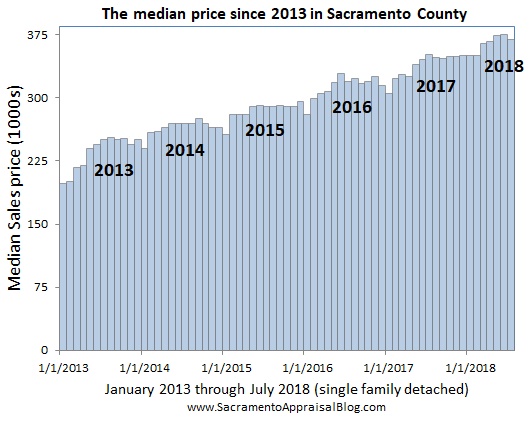
Last year the fall season felt more flat than not, but this year is a different story. We are definitely having more of a dull seasonal lull that reminds us how the market felt in 2014 when the fall season was definitively soft. Here are some of the things I’m watching right now. I’d love to hear what you are seeing. Please comment below or send me an email.
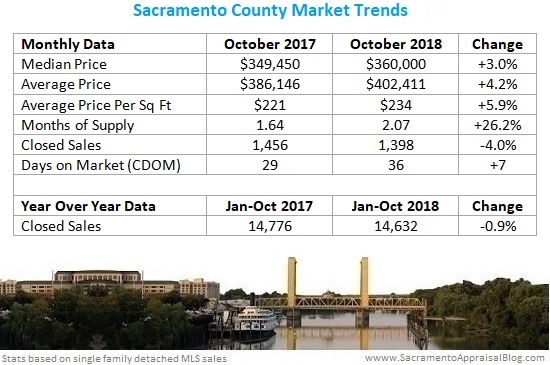
Graphs for your newsletter and social media: Please download all graphs here as a zip file. See my sharing policy for 5 ways to share (please don’t copy my post verbatim).

Adjusting to rates: Buyers have seemed to back off the market a bit lately, and we’re seeing the effect of that with lower sales volume. What’s up with this? The culprit could be increasing interest rates and a growing lack of affordability.

Balancing of power: Buyers have gained more power in recent months, though I don’t think sellers got the memo since they are still struggling with overpricing and pretending it’s an aggressive market from 2013 instead of a slower market in 2018. This doesn’t mean buyers have total control though. Keep in mind 41% of all sales last month had multiple offers, which tells us it’s not the type of market where buyers can lowball sellers and get whatever price they want.

Pricing lower this fall: Since the summer the median price has softened by 4% in Sacramento County, 5% in the region, and 7% in Placer County. This doesn’t mean every neighborhood lost 4-7% in value. These are county stats and they don’t translate into every area or price range. Keep in mind it’s normal to see a 5% or so reduction in the median price during a given fall season, but this year it wouldn’t be surprising to see a more pronounced price difference between spring and fall (we’ll see how it pans out).

The story of sales volume: In September volume was down a whopping 16% in the region, and that raised lots of eyebrows to make people wonder if the market was starting to tank. This past month sales volume was not as weak, but it was still down nearly 9% in the region and about 4% in Sacramento County. Over time we need to keep watching this trend to better understand if it’s a sign of a definitive change in the market or if it’s the byproduct of a dull fall season (or both). One thing to remember is despite a few months of gloomy sales volume recently, volume is only down 2% in 2018 in the Sacramento region.

Listings did peak: I’ve been talking about listings looking like they were peaking for the past couple months, and the stats now definitely show listings have crested for the season. This is normal for the time of year as sellers tend to pull back from the market and wait until spring to list. This is why the fall sometimes feels like a market of leftovers since many sellers are waiting until the next year.

Concessions and credits: Buyers have more options today, so they’re tending to ask sellers more often for credits, repairs, and concessions. It would be wise for sellers to listen to buyers and be aware they may need to give something to get the deal done.

I could write more, but let’s get visual instead.

BIG QUESTIONS:

1) How did the market change from last year?

2) How did the market change from September to October?

3) Where are we in relation to peak prices in 2005?

4) What’s happening with sales volume?

SACRAMENTO COUNTY VOLUME:

Key Stats:

  • October volume down 4%
  • 2018 volume down 1% (January to October)
  • Annual volume is down 1.9% (past 12 months)
  • Volume has been strong this year, but it’s definitely been down over the past 4-5 months.

SACRAMENTO REGION VOLUME:

Key Stats:

  • October volume down 8.8%
  • 2018 volume down 2.1% (January to October)
  • Annual volume is down 2.5% (past 12 months)
  • Volume has been strong this year overall, but it’s been down over the past 4-5 months.

PLACER COUNTY VOLUME:

Key Stats:

  • October volume down 20.6%
  • 2018 volume down 4.9% (January to October)
  • Annual volume is down 5.4% (past 12 months)

SACRAMENTO COUNTY (more graphs here):

SACRAMENTO REGION (more graphs here):

PLACER COUNTY (more graphs here):

I hope that was helpful.

DOWNLOAD 60 graphs HERE: Please download all graphs here as a zip file. See my sharing policy for 5 ways to share (please don’t copy verbatim).

Questions: What do you see happening in the market right now? What are you hearing from buyers and sellers? I’d love to hear your take.

If you liked this post, subscribe by email (or RSS). Thanks for being here.

Share:

  • Click to share on Twitter (Opens in new window)
  • Click to share on Facebook (Opens in new window)
  • Click to share on LinkedIn (Opens in new window)

Filed Under: Market Trends Tagged With: Appraisal, Appraiser, CDOM, days on market, DOM, dull fall season, housig market in Sacramento, lower prices, Placer County housing market, real estate graphs, sacramento housing market, sacramento regional appraisal blog, sacramento regional housing market, slowing market, softening prices

How would you know if the market was starting to tank?

August 14, 2018 By Ryan Lundquist 29 Comments

Is the market starting to tank? Or is it just a seasonal slowing? I’m getting asked this question all the time, so I wanted to share some thoughts. Then I have a big local market update for anyone interested.

How would you know if the market was sliding? I wish this was a 10-second answer, but it’s a big conversation, so let’s unpack some thoughts. 

1) Change in inventory: It’s normal for housing inventory to increase as a market begins to cool for the season, but when a market starts to make a big turn we’d likely notice new listings aren’t being absorbed and the number of listings keeps growing beyond a normal pace.

2) Change in sales volume: Sales volume usually slows down as the market cools, but during a big shift we’d expect to see a more substantial change in sales volume over time. I’m talking about a market where buyers put on the brakes and properties stop selling. Currently in many areas throughout the country we’re seeing some smaller changes in sales volume. Could it be the start of something? Sure. But in my mind we need more time to see if this is a consistent pattern or just a slower end of the year.

3) Word on the street: What are people saying? How does the market feel in the trenches? We can learn so much when talking with informed local buyers, sellers, agents, appraisers, and other real estate professionals. Ask things like, “What are you seeing out there?”, or “What’s the market doing?” This is important because before we see a change in stats we’ll hear of change in the trenches. As an FYI, here’s a Twitter poll from a few days ago.

4) Less pendings: When a market starts to slide we can expect to see less pending sales, which is a big sign of waning demand. Let’s just remember though around this time of year we usually see fewer pendings as the market cools. This means we have to be cautious about saying the market is crashing just because pendings soften. My advice? Look for abnormal changes beyond a regular seasonal dip in pending sales.

5) Price changes aren’t the big issue: When a market shifts directions we often look to prices to tell us if things are changing, but it takes time for prices to catch up with the trend. For example, in Sacramento in 2005 we saw housing inventory triple and sales volume drop 43% in one year. Yikes! Those are insane stats, but price changes weren’t all that dramatic during this time period.

6) Other metrics: Lots of experts say to watch the number of new homes built as an indicator of the market changing. That’s huge. Others say it’s the GDP or economy, easy credit, housing affordability index, or flux capacitor sales (kidding on that one). There are definitely important indicators out there, and we should tune in, but for a local market I might suggest paying the most attention to inventory, sales volume, and the word on the street. If new construction is booming in your market though, definitely watch that too.

7) A closing dating analogy: Just like a dating relationship needs time to figure out what it’s going to be become, the same thing happens in real estate. Right now in many areas of the country we’re seeing inventory increase and sales volume starting to slump. At the least these are signs of a slowing market for the season, but it also makes us wonder if it’s something more. What does it really mean? Where will things go? The truth is we don’t fully know yet because the future hasn’t happened and we need more time to see how things unfold. I realize that’s frustrating to hear, but it’s honest.

CLOSING TIPS:

1) Crystal balls: If you don’t have a crystal ball that works, be careful about making very specific real estate predictions.

2) Watch local data closely: More than ever it’s critical to watch local data. Lots of articles are talking about “national” trends, but what’s happening locally?

3) Don’t just regurgitate headlines: It’s easy to read headlines and let the titles become our talking points. Be careful of that since headlines are designed to get clicks and they may or may not reflect the market.

4) Know the season: It’s not always easy to understand what a market is doing at this time of year when things usually slow down. My advice? Understand normal seasonal trends by studying past years. What does the market normally do at this time of year? This will help us spot normal vs abnormal trends. 

I hope that was helpful.

—–——– Big local monthly market update (long on purpose) —–——–

The market has been slowing for the past few months in Sacramento. We’re seeing what we’d expect to see at this time of the year like softer prices, more price reductions, a lower sales-to-list price ratio, and it’s taking longer to sell. We’ve had a hefty uptick in housing inventory though, and that’s something to watch – especially if it continues over time (that would be a problem). But for context, housing inventory is actually still historically low, so it’s not like we have a crazy high level right now. Some have wondered if the market is a bit stalled right now, but sales volume is still looking pretty strong and so are pendings. But I’d say there is some shock in the market because of the rise in inventory. Keep in mind one of the problems is so many sellers are overpricing, and that only makes inventory increase because these properties end up sitting instead of selling. On the other hand homes that are priced well are moving quickly, and 48% of all sales in the region last month had more than one offer. So despite a slowing narrative, the market isn’t painfully dull either.

I could write more, but let’s get visual instead.

DOWNLOAD 64 graphs HERE: Please download all graphs here as a zip file. See my sharing policy for 5 ways to share (please don’t copy verbatim).

JULY 2017 vs JULY 2018: So how did this past month do? One of the ways we find the answer is to compare last month with the same month in 2017. 

JUNE 2018 vs JULY 2018 (NEW CHARTS): The problem is if we only look at July this year versus July last year, we’ll miss what the market is doing right now. So that’s why I have new charts to show the previous month vs the most recent month. But there’s still an issue because if we only look at this chart and don’t understand that the market normally softens around this time of year, we might walk away with the idea that the market is utterly tanking when it’s normal to see inventory increase, sales volume decline, etc… Look at graphs below to help see seasonal changes (or check out this older YouTube video where I talk about seeing the seasonal market).

SALES VOLUME: One of the things we need to watch is sales volume because if we start to see a trend of slumping sales, it could be a sign the market is in trouble. The truth is we’ve technically had a couple of months in a row of lower sales volume in the region. But volume was only off by 4% in June and it was barely off at all this past month (which is why I said “technically”). When you really look at it, sales volume this year in 2018 so far has been stronger than last year. But when we look at the past 12 months as a whole it’s clear volume is down (still only slightly though). Ultimately volume is not crashing right now based on the stats, so let’s be careful about saying it is.

NOTE on Trendgraphix: I have some thoughts on the way Trendgraphix is pulling stats. This month their stats show sales volume in Sacramento County is down by 6%, but that’s not accurate. I can explain why if anyone wants to know. And I love Trendgraphix. What an incredible resource. I just find when we’re looking at the market carefully in a time like this, it’s critical to know how the numbers work.

2005 vs CURRENT: In case you wanted to compare current price metrics with 2005, here you go. A couple of months ago I talked about peak prices because some metrics were showing 2005 levels. But with the market softening right now we’ll expect over the fall season to see current prices grow further apart from the “top” so to speak.

SACRAMENTO COUNTY (more graphs here):

SACRAMENTO REGION (more graphs here):

PLACER COUNTY (more graphs here):

I hope that was helpful.

DOWNLOAD 64 graphs HERE: Please download all graphs here as a zip file. See my sharing policy for 5 ways to share (please don’t copy verbatim).

Questions: What would you look for to know the market was turning? What are you seeing out there right now? I’d love to hear your take.

If you liked this post, subscribe by email (or RSS). Thanks for being here.

Share:

  • Click to share on Twitter (Opens in new window)
  • Click to share on Facebook (Opens in new window)
  • Click to share on LinkedIn (Opens in new window)

Filed Under: Market Trends Tagged With: appraisal blogs in sacramento, Housing Bubble, increase of listings in sacramento, Placer County, real estate trends, rising inventory, Sacramento Appraisal Blog, sacramento housing blog, sacramento region housing market, sales volume, seasonal market, softening prices, trend graphs

Primary Sidebar

Connect with Ryan

 Facebook Twitter LinkedIn YouTube Instagram

Subscribe to Weekly Post

* indicates required

Search this site

Blog Categories

  • Appraisal Stuff (407)
  • Bankruptcy (3)
  • Divorce (4)
  • Estate Settlement (6)
  • FHA Appraisal Articles (56)
  • Internet (53)
  • Market Trends (482)
  • Photos from the Field (126)
  • Property Taxes (70)
  • Random Stuff (231)
  • Resources (566)
  • Videos (161)

Blog Archives: 2009 – 2021

Lundquist Appraisal Links

  • Appraisal Order Form
  • Appraisal Website
  • Rancho Cordova Appraiser Website
  • Sacramento Appraisal Blog Sitemap
  • Sacramento Real Estate Appraiser Facebook Page
  • Twitter: Sacramento Appraiser (@SacAppraiser)
  • YouTube: Sacramento Appraiser Channel

Most Recent Posts

  • How much have prices risen since 2012?
  • How long can this market keep going?
  • What is your housing persona?
  • Rapid price growth & the Gilmore Girls next door
  • Are first-time buyers targeting 2-4 unit properties?
  • Stale real estate headlines & buyers flocking to El Dorado County
  • My new sewer line adds huge value, right?
  • The housing market nobody predicted
  • Real estate trends to watch in 2021
  • You carried me & a spreadsheet for Christmas

Disclaimer

First off, thank you for being here. Now let's get into the fine print. The material and information contained on this website is the copyrighted property of Ryan Lundquist and Lundquist Appraisal Company. Content on this website may not be reproduced or republished without prior written permission from Ryan Lundquist.

Please see my Sharing Policy on the navigation bar if you are interested in sharing portions of any content on this blog.

The information on this website is meant entirely for educational purposes and is not intended in any way to support an opinion of value for your appraisal needs or any sort of value conclusion for a loan, litigation, tax appeal or any other potential real estate or non-real estate purpose. The material found on this website is meant for casual reading only and is not intended for use in a court of law or any other legal use. Ryan will not appear in court in any capacity based on any information posted here. For more detailed market analysis to be used for an appraisal report or any appraisal-related purpose or valuation consulting, please contact Ryan at 916-595-3735 for more information.

There are no affiliate links on this blog, but there are three advertisements. Please do your homework before doing business with any advertisers as advertisements are not affiliated with this blog in any way. Two ads are located on the sidebar and one is at the bottom of each post. The ads earn a minor amount of revenue and are a simple reward for providing consistent original content to readers. If you think the ads interfere with your blog experience or the integrity of the blog somehow, let me know. I'm always open to feedback. Thank you again for being here.

Copyright © 2021 Sacramento Appraisal Blog