Let’s take a wider view of real estate today. I shared by big monthly post last week about Sacramento County, but what is regional market doing when we consider multiple counties surrounding Sacramento? Let’s look at five quick trends below.

Two ways to read this post:
- Briefly scan the 5 talking points and graphs below in 1 minute.
- Take a few minutes to digest the graphs and commentary.
Enjoy and let me know what you think.

Your message has been sent
THE SACRAMENTO REGION:
1) Prices have been flat for 4 months:

The median price has been the same for four months in the Sacramento Region, which is why so many in the real estate community have been talking about a flat market. As you can see on the graph, values cool off when inventory increases.
But Trendgraphix says… Trendgraphix shows the median price increased over the past few months from $310,000 to $315,000 for the Sacramento Region, but they seem to have pulled their sales data too early. When running stats in MLS for the past four months, the median price is clearly stable at $310,000 for each respective month. This is not to bash Trendgraphix at all because I am an enormous fan of their work. I only wanted to point out the importance of waiting long enough to publish stats, and how publishing even a few days too early can make a big difference.
2) Inventory is steadily increasing in the Sacramento Region:

Housing inventory has been increasing and is helping fuel a greater sense of confidence among buyers (they’ve become more picky too), as well as many price reductions. Housing inventory increased from 2.50 months to 2.64 months over the course of the past month. Inventory is still not very high, but many sellers seem to have an unrealistic mindset about what their properties are worth, which is only leading to inevitable price reductions. Moreover, we are seeing weaker demand than in years past in light of less cash investors playing the market. My advice? Consider pricing according to the most recent competitive listings, that is, ones that are actually getting into contract (as opposed to the highest sale in the neighborhood three months ago).

The graph above is a slightly different way to look at inventory. As you can see, the bulk of listings are between 200-400K, but there are quite a few from 400-750K too. Remember, not every price range, neighborhood, or property type is experiencing the same exact trend.
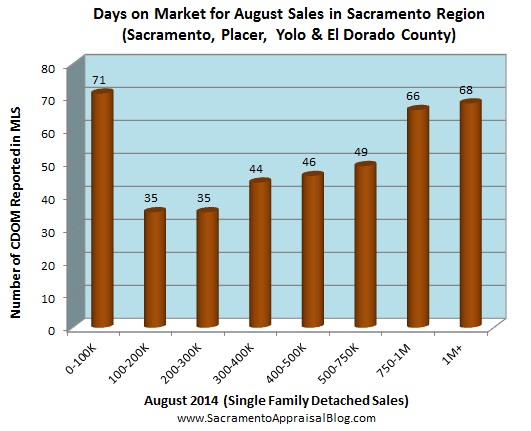
3) It took 2 days longer to sell a home last month:

In July it took three days longer to sell a home, and last month it took days longer. When days on market increases, it’s a sign the market is slowing down. Yet at the same time this is a very normal trend because the hot buying season does fade away as summer closes. Generally speaking, the higher the price, the longer it is taking to sell.
4) Sales volume is down 10% in 2014 compared to 2013:


Sales volume is down by slightly more than 10% this year compared to last year, and less sales is definitely one of the factors helping to cool the housing market. Less sales has led to increased inventory and a transfer of power from sellers to buyers.
5) Cash is down by 37% this year in the Sacramento Region:

I mentioned already that the sales volume is down by 10%, but the X-factor for lower volume is really less cash sales. There have only been about 50 more non-cash sales in 2014 compared to 2013, but almost 2000 less cash sales this year. Having this many fewer sales has made certain months in the year feel sluggish, and it’s certainly contributed to the flattening trend we’ve seen over the past several months.
BONUS MATERIAL: PLACER COUNTY


Uptick, but still flat in Placer County: Placer County saw an uptick in median price last month, but it’s not really anything to write home about. One month of data does not mean the market is now increasing after being flat. Moreover, when talking with real estate agents, Placer County is very similar to Sacramento County in that the market is very price sensitive. If it’s not priced right, it’s going to sit.


Inventory in Placer County increased last month: Monthly inventory saw an increase last month from 2.72 months to 2.91 months. This effectively means there are 2.91 months worth of houses for sale in Placer County right now. Generally speaking, the higher the price, the more inventory there is.
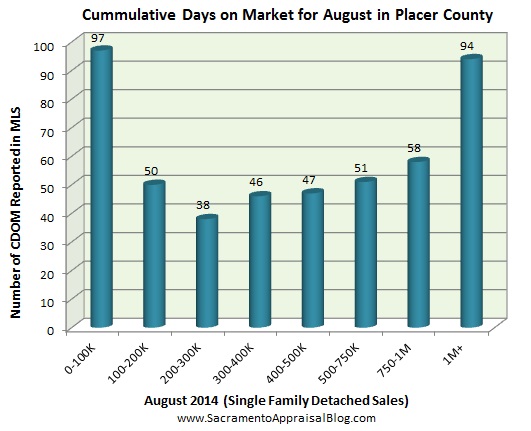
 It’s taking two days longer to sell compared to last month: On average it is taking 47 days to sell a home in Placer County compared with 45 days last month. For context it is taking 40 days in Sacramento County and 42 days in the entire region. There were only 2 sales under $100,000, so disregard the 97 days listed above.

Sales volume was fairly similar to last month: Sales volume was similar to last month, and is overall approaching more normal levels (though volume is still down slightly from 2013).
Sharing Trends? It’s a huge joy to put together these graphs each month, and I hope they’re helpful for you and your contacts. If you want to share graphs online or in your newsletter, please see my sharing policy. I hope you reach out for the graphs I didn’t post here too as I’d love to make those available to you. Fill out the form above or send me an email.
Thank you for being here.
Question: How else would you describe the market? I’d love to hear your take no matter what your level of interest or knowledge is about the housing market.
If you liked this post, subscribe by email (or RSS). Thanks for being here.


