The housing market feels like leftovers right now. It’s that time of year where we see less new listings due to sellers hibernating for the holidays, and some of the existing inventory just feels as stale as Aunt Tina’s green bean casserole that nobody wants to see during Thanksgiving. Wait, did I say that out loud? Anyway, today let’s talk about credit card debt, the current market, and some NEW COUNTIES I’m starting to cover for stats.

UPCOMING (PUBLIC) SPEAKING GIGS:
11/16/23 Mega Agent Panel (register here)
11/30/23 Safe CU “Preparing for a Successful New Year”
12/08/23 Free Appraiser Q&A on Private Work (one hour here)
(Meeting ID: 832 2414 3890 Passcode: 007)
01/30/24 Joel Wright & Mike Gobbi Event 9am (on Zoom here)
3/11/24 Yolo Association of Realtors (details TBA)
FEELING THE STING OF INFLATION
I don’t know about you, but everything has felt so expensive lately in my household. Can you relate? Consumers are definitely feeling the sting of inflation, but they’re still buying stuff (just not real estate so much).

GETTING INTO CREDIT CARD TROUBLE
Credit card debt has been rising lately. It’s nowhere near 2007 levels, but let’s not ignore that people are starting to get into trouble (especially younger people). Source: NY Fed (PDF).


HOW I’M DESCRIBING THE MARKET
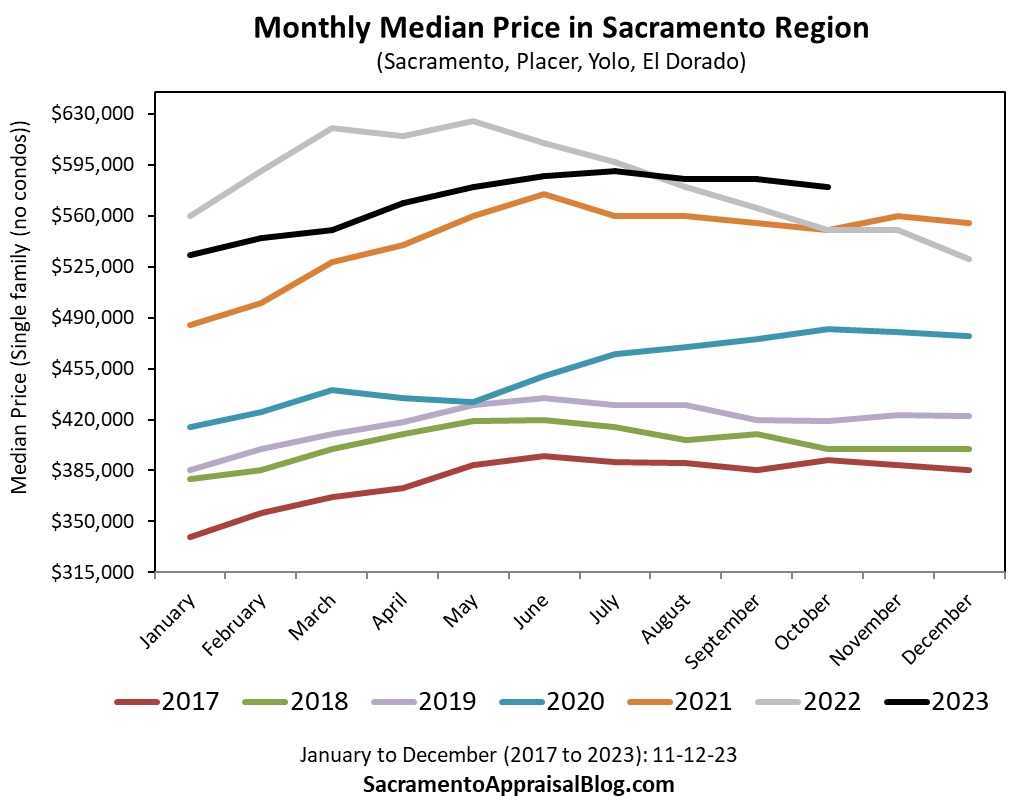
We’ve had a pretty normal fall dynamic in many ways, and it’s been very different from the sharp change last year. Prices have softened, it’s taking longer to sell, and we’re seeing less sales, which is all typical. But one thing that isn’t normal is active listings have increased over the past couple of months. At this time of year, we almost always see actives shrink, but not this year. What’s the cause? There have been fewer pending contracts lately, and that’s made the pile of active listings grow larger since properties are staying on the market (not caused by sellers rushing to list more). We’re only talking about a few hundred extra listings in the region, so let’s not sensationalize this, but obviously more listings can affect the real estate temperature. Oh, and let me clarify. We are nowhere close to a normal number of sales. It’s still been such a strange market with low volume and still low supply. By the way, here’s a thread I wrote about actives on Twitter in case there is interest.
THE RATE NARRATIVE CHANGED QUICKLY
Rates have dropped in the past two weeks, and the narrative has shifted. Many were preaching, “Rates at 8% for longer,” but now it’s, “Bro, 6% rates soon.” I get the logic of rates dropping ahead, but we also need to see what actually happens. I think it’s important to talk through all potential scenarios while remaining objective since there is still so much uncertainty.
NEW COUNTIES COVERED:
I’m taking some new counties for a test drive. If you want to see these on a consistent basis, please let me know. Also, smaller areas are in 60-day chunks since stats can be erratic with only 30 days (is that a good idea or not?).


NEW COLORS FOR THESE COUNTIES
I’m going through many visuals to update colors so there is consistency in branding. So, the colors below correspond to the colors in the stats above.


AND NOW DAYS ON MARKET WITH COLORS:


OTHER VISUALS:
I have many other visuals, but that’s it for now (besides these). Catch me on my socials every day for lots of perspective and stats that never make it here.


Thanks for being here.
Questions: How would you describe the market right now? What do you think about the new visuals? What would you like to see more of? I’d love to hear.
If you liked this post, subscribe by email (or RSS). Thanks for being here.