• Skip to primary navigation
  • Skip to main content
  • Skip to primary sidebar

Sacramento Appraisal Blog | Real Estate Appraiser

Real estate appraisals for divorce, estate settlement, loans, property tax appeal, pre-listing and more. We cover Sacramento, Placer and Yolo County. We're professional, courteous and timely.

  • About
  • Appraisals
  • Order
  • Ask Ryan
  • Areas
  • Classes
  • Press
  • Trends
  • Share
  • Contact

increasing inventory

The players in the market & normal pendings

February 12, 2019 By Ryan Lundquist 17 Comments

Who are the players in the market? Who is buying and selling? Who is coming? Who is going? These are questions we have to ask to grasp a local market. And for real estate professionals, knowing who the players are helps us serve clients well and sometimes even make future business plans. 

Well, let’s talk about a new player in town called Opendoor. This company is trying to gain a foothold in about 20 markets across the country right now. If you’re not local, are they in your area?

Opendoor posted up in Sacramento last year and they’ve begun to make a splash. They’re not dominating the market by any stretch, but in the region over the past few months they bought over 90 homes. I don’t fully understand the fine print of their business model yet, but in a nutshell they buy from owners privately and then put these homes back on the market to sell to the public. In fact, mostly all of their private purchases are currently re-listed on our local MLS. Opendoor also has an affiliation with Lennar – a local builder.

My real estate antennas: Any time I see a group buying a larger amount of homes, I pay attention. In the past I talked heavily about Blackstone, and in the future I’ll discuss other players whether they’re making a splash or shaping the market (like Blackstone did). Any stories or thoughts?

Now for those interested, let’s talk about the market – especially pendings.

I hope this was interesting or helpful.

—–——– Big local monthly market update (long on purpose) —–——–

The market slumped during the second half of 2018, and now it’s an interesting spot. Let’s talk about it.

THE SHORT VERSION:

  • Pendings were normal for January
  • Sales volume has slumped for 8 months in a row
  • Prices are barely up from last year
  • Most metrics softened as expected for January
  • The market is starting to wake up for the spring
  • This post is long on purpose. Skim or pour a cup of coffee.

DOWNLOAD 70+ graphs: Please download all graphs here as a zip file. See my sharing policy for 5 ways to share (please don’t copy verbatim).

THE LONGER VERSION:

Here’s some of the bigger topics to consider right now.

We need time: We don’t have a totally clear picture for where the market is going yet in 2019. We still need more time. Here is what I am specifically looking for in the stats over these next few months.

Normal pendings: It’s big news that pending sales were normal this past month compared to last January. We’ve had a slump in sales volume for eight months, so what does this mean? Well, it could be the market trying to find some normalcy after two quarters of sluggishness. Though the real cause very likely stems from mortgage rates recently declining. It’s amazing how that can affect buyers and even sales volume. Remember, pendings in January will likely close in February and especially March. So if we start to see a normal level of pendings in January and February, we may see sales volume show normalcy for the time being.

Yeah, most metrics softened: We saw the typical signs we’d expect to see at this time of year with most metrics. It look longer to sell last month, prices dipped, inventory increased, and sales volume sloughed. Though overall the softening in most metrics felt way more pronounced.

Low rates are steroids: Mortgage rates declined and that’s seeming to draw some buyers back into the market. Low rates are like steroids for demand – at least temporarily.

More listings this year: There’s more listings this year compared to last year at the same time. In fact, it’s been about five years since we’ve started the year with this much housing supply.

Waking up: I’m hearing from many agents about more buyer attention on their listings lately. More traffic at open houses. More offers. It’s still to be determined what this spring market will look like exactly, but for now the spring season is starting to move.

Not seeing aggressive price gains: The rate of price change has slowed. What I mean is in years past we’d see 7-10% price increases when running stats, but now we’re seeing modest 2-3% year-over-year price gains. 

In case you need slumping trivia to impress friends: Last month we saw the worst sales volume in 11 years for a January. We’ve had eight months in a row of year-over-year sales volume declines. That’s a dismal stat and there’s no sugar-coating it. If this trend doesn’t change we’re going to have a much different market. Yet this is why seeing normal pendings for January is a big deal because today’s level of pendings could presumably show a normal number of sales in a couple of months when these properties close.

The Tallest Graph in Sacramento: Here’s a look at over 60,000 single family detached sales in Sacramento County. This graph is inspired by Jonathan Miller.

Less offers: Here’s an interesting way to see the market has slowed. Multiple offers are down about 11% this year.

More concessions in new construction: Lots of builders are offering credits and concessions to help get their deals done lately. This is a symptom of a slower market. It seems more sellers are also offering concessions and credits too. Buyers, don’t be afraid to negotiate with sellers since the market has slowed, but at the same time don’t think you are driving the market either. Keep your perception of power in check. And sellers, talk with your agent about whether credits or concessions might need to be an option on the table.

Final thought before the graphs: In closing, the market is in an interesting spot. It feels like it’s juggling uncertainty from last year with a striving for normalcy today. We only have one month of data and we need to keep watching to see how this market is going to emerge.

I could write more, but let’s get visual instead.

BIG ISSUES TO WATCH:

1) SLOWING MOMENTUM: The stats show the market is slowing down when we look at the rate of change by year. Looking at monthly, quarterly, and annual numbers helps give a balanced view of things.

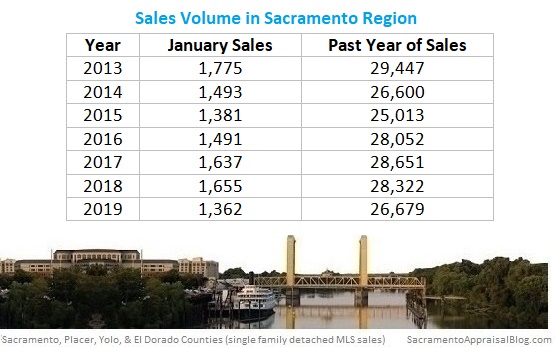
2) SALES VOLUME SLUMP: It’s important to look at sales volume in a few ways to get the bigger picture. Here it is by month and year.
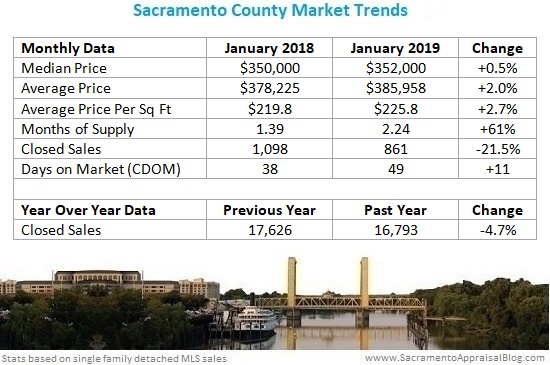
SACRAMENTO COUNTY:

Key Stats:

  • January volume down 21.5%
  • Volume is down 4.7% over the past 12 months

SACRAMENTO REGION:

Key Stats:

  • January volume down 17.7%
  • Volume is down 5.8% over the past 12 months

PLACER COUNTY:

Key Stats:

  • January volume down 10.9%
  • Volume is down 7.7% over the past 12 months

3) LAST YEAR VS THIS YEAR: Here’s a comparison of last year compared to the same time this year. What do you see?

NOTE: Placer County had very few sales this January, so I wouldn’t put much weight on the price figures for this month.

SACRAMENTO COUNTY (more graphs here):


SACRAMENTO REGION (more graphs here):

PLACER COUNTY (more graphs here):

I hope that was helpful.

DOWNLOAD 70+ graphs: Please download all graphs here as a zip file. See my sharing policy for 5 ways to share (please don’t copy verbatim).

BLOG BASH: Just a reminder I’m hosting a blog party on March 2nd from 3-7pm. You’re invited to celebrate my blog’s 10th birthday. I know, that sounds a little cheesy. But I’ll be buying the first 100 beers… Details here.

Questions: Any stories to share about who is playing the market right now? What are you experiencing right now in the trenches with buyers and sellers?

If you liked this post, subscribe by email (or RSS). Thanks for being here.

Share:

  • Click to share on Twitter (Opens in new window)
  • Click to share on Facebook (Opens in new window)
  • Click to share on LinkedIn (Opens in new window)

Filed Under: Market Trends Tagged With: Appraisal, Appraiser, buyers and sellers, buying and selling, Home Appraiser, House Appraiser, increasing inventory, inventory, investors, million dollar sales, multilpe offers, new construction, Opendoor, Sacramento Real Estate Appraiser, sacramento regional real estate blog, sales volume slump, trend graphs

The market is slowing (we’re not surprised)

July 13, 2018 By Ryan Lundquist 20 Comments

The market is slowing. Most who work in real estate have sensed this and felt a “disturbance in the force” so to speak (Star Wars). The signs are clear, but sellers are slow to catch on because they’re stuck on “hot” headlines. Anyway, let’s talk briefly, and then for those interested I have a big market update.

QUICK TAKEAWAYS:

1) Slowing isn’t a surprise: You know what would be odd? If the market didn’t slow down for the season. Real estate tends to be cyclical and at some point each year it’s no surprise to see prices begin a downward descent after a high-altitude spring flight.

2) Not everything is slowing: Some markets throughout the country are in a stage of softening, but that’s not true everywhere. Moreover, let’s remember different price ranges, neighborhoods,and property types could be experiencing different trends. 

3) Being an expert: For real estate professionals wanting to position themselves as market experts, it’s critical to be able to recognize the symptoms of a slowing market and to be able to communicate those to clients. It’s far too easy to speak in clichés or write in boiler plate, but the market is always changing, so let’s say something different as it does change.

4) Sellers: Are you listening?

I hope that was helpful. Feel free to use the image above as you see fit.

—–——– Big local monthly market update (long on purpose) —–——–

The market is slowing. I’m not saying it’s cold or declining. And this doesn’t mean it’s not competitive either. It is. But there are clear signs the market is shifting for the season. Housing inventory is increasing. It’s starting to take longer to sell. Many prices metrics softened slightly or flattened in June. We’re seeing more price reductions. The sales to list price ratio declined 1%, and even the number of multiple offers declined last month from the previous month in Sacramento County. No matter how we look at it, the market is slowing.

EARLY SLOWING: When real estate begins to slow people often freak out because it’s easy to think the market is starting to crash. Right now the stats look consistent with what we’d expect to see at t his time of year though, so I’ll keep saying this is a normal seasonal slowing unless I have a reason not to. Yet it’s interesting to see the market did begin cooling about a month early this year (that could be due to having more inventory so far in 2018).

LOTS OF INVENTORY: Housing supply in the region is up almost 20% this year compared to last year at the same time, and that makes a difference with how the market feels. Keep in mind inventory is still very low, yet this is something to watch because changes in inventory really do affect the feel and pace of the market. For any “bubble hunters” out there, be cautious about comparing this increase in housing supply with 2005 because so far the market is handling the listings that are out there (besides the overpriced ones). In 2005 housing supply literally doubled in Sacramento County in about 90 days, and sales volume dropped 40% over one year. That’s not the same thing as today.

MY FAVORITE CHART EVER: I made this visual a few days ago and I think it’s fascinating to see price changes like this. You like?

SALES VOLUME RHYTHM: Sales volume has seemed to find a rhythm lately. Before 2005 there was a huge uptick in sales, but then volume crashed when the market imploded. In recent years it looks more stable. As you can see during the first two quarters of the year the market has tended to have somewhere around 13,000 or so sales lately.

I could write more, but let’s get visual instead.

DOWNLOAD 57 graphs HERE: Please download all graphs here as a zip file. See my sharing policy for 5 ways to share (please don’t copy verbatim).

SACRAMENTO COUNTY (more graphs here):

SACRAMENTO REGION (more graphs here):

PLACER COUNTY (more graphs here):

DOWNLOAD 57 graphs HERE: Please download all graphs here as a zip file. See my sharing policy for 5 ways to share (please don’t copy verbatim).

Questions: In what ways if any are you seeing the market slow? What are you hearing buyers and sellers saying about the market? I’d love to hear your take.

If you liked this post, subscribe by email (or RSS). Thanks for being here.

Share:

  • Click to share on Twitter (Opens in new window)
  • Click to share on Facebook (Opens in new window)
  • Click to share on LinkedIn (Opens in new window)

Filed Under: Market Trends Tagged With: home appraiser blog sacramento region, increasing inventory, Sacramento Appraisal Blog, seasonal slowing, signs of a slowing real estate market, slow real estate market, slower prices, slowing market, slowing vs crashing

5 trends to watch in Sacramento’s flattening real estate market

September 16, 2014 By Ryan Lundquist Leave a Comment

Let’s take a wider view of real estate today. I shared by big monthly post last week about Sacramento County, but what is regional market doing when we consider multiple counties surrounding Sacramento? Let’s look at five quick trends below.

Taking a wide view of real estate - image purchased by sacramento appraisal blog

Two ways to read this post:

  1. Briefly scan the 5 talking points and graphs below in 1 minute.
  2. Take a few minutes to digest the graphs and commentary.

Enjoy and let me know what you think.

free market trend graphs from sacramento appraisal blog

THE SACRAMENTO REGION:

1) Prices have been flat for 4 months:

median price sacramento placer yolo el dorado county

The median price has been the same for four months in the Sacramento Region, which is why so many in the real estate community have been talking about a flat market. As you can see on the graph, values cool off when inventory increases.

But Trendgraphix says… Trendgraphix shows the median price increased over the past few months from $310,000 to $315,000 for the Sacramento Region, but they seem to have pulled their sales data too early. When running stats in MLS for the past four months, the median price is clearly stable at $310,000 for each respective month. This is not to bash Trendgraphix at all because I am an enormous fan of their work. I only wanted to point out the importance of waiting long enough to publish stats, and how publishing even a few days too early can make a big difference.

2) Inventory is steadily increasing in the Sacramento Region:

months of housing inventory in region by sacramento appraisal blog

Housing inventory has been increasing and is helping fuel a greater sense of confidence among buyers (they’ve become more picky too), as well as many price reductions. Housing inventory increased from 2.50 months to 2.64 months over the course of the past month. Inventory is still not very high, but many sellers seem to have an unrealistic mindset about what their properties are worth, which is only leading to inevitable price reductions. Moreover, we are seeing weaker demand than in years past in light of less cash investors playing the market. My advice? Consider pricing according to the most recent competitive listings, that is, ones that are actually getting into contract (as opposed to the highest sale in the neighborhood three months ago).

number of listings in Placer  Yolo El Dorado Sacramento - by home appraiser blog

The graph above is a slightly different way to look at inventory. As you can see, the bulk of listings are between 200-400K, but there are quite a few from 400-750K too. Remember, not every price range, neighborhood, or property type is experiencing the same exact trend.

3) It took 2 days longer to sell a home last month:

days on market in placer sac el dorado yolo county by sacramento appraisal blog

In July it took three days longer to sell a home, and last month it took days longer. When days on market increases, it’s a sign the market is slowing down. Yet at the same time this is a very normal trend because the hot buying season does fade away as summer closes. Generally speaking, the higher the price, the longer it is taking to sell.

4) Sales volume is down 10% in 2014 compared to 2013:

SALES volume in sacramento region - by home appraiser blog

number of listings in Placer Sacramento Yolo El Dorado county - July 2014 - by home appraiser blog

Sales volume is down by slightly more than 10% this year compared to last year, and less sales is definitely one of the factors helping to cool the housing market. Less sales has led to increased inventory and a transfer of power from sellers to buyers.

5) Cash is down by 37% this year in the Sacramento Region:

cash sales and volume in sacramento region - by home appraiser blog

I mentioned already that the sales volume is down by 10%, but the X-factor for lower volume is really less cash sales. There have only been about 50 more non-cash sales in 2014 compared to 2013, but almost 2000 less cash sales this year. Having this many fewer sales has made certain months in the year feel sluggish, and it’s certainly contributed to the flattening trend we’ve seen over the past several months.

BONUS MATERIAL: PLACER COUNTY

Placer County median price and inventory - by home appraiser blog

median price in placer county and sacramento county by sacramento appraisal blog

Uptick, but still flat in Placer County: Placer County saw an uptick in median price last month, but it’s not really anything to write home about. One month of data does not mean the market is now increasing after being flat. Moreover, when talking with real estate agents, Placer County is very similar to Sacramento County in that the market is very price sensitive. If it’s not priced right, it’s going to sit.

Placer County housing inventory - by home appraiser blog

months of housing inventory in placer county by sacramento appraisal blog

Inventory in Placer County increased last month: Monthly inventory saw an increase last month from 2.72 months to 2.91 months. This effectively means there are 2.91 months worth of houses for sale in Placer County right now. Generally speaking, the higher the price, the more inventory there is.

days on market in placer county by sacramento appraisal blog
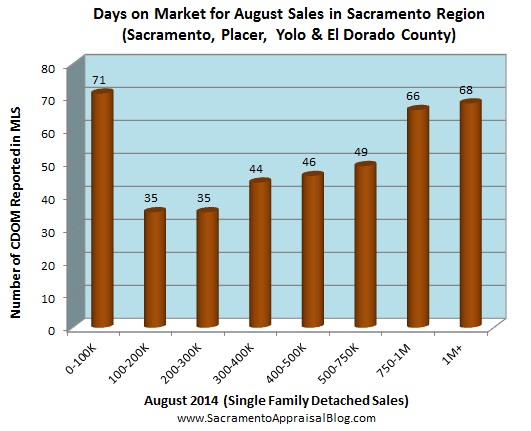
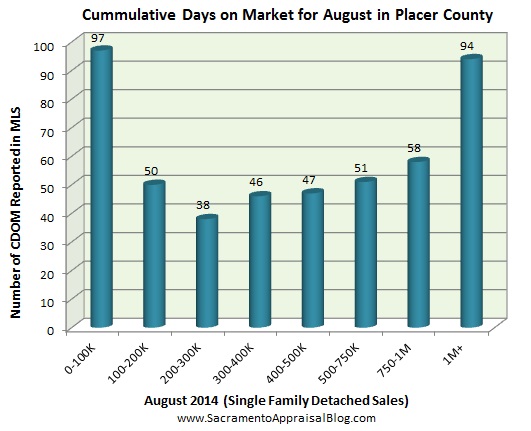
It’s taking two days longer to sell compared to last month: On average it is taking 47 days to sell a home in Placer County compared with 45 days last month. For context it is taking 40 days in Sacramento County and 42 days in the entire region. There were only 2 sales under $100,000, so disregard the 97 days listed above.

Placer County sales volume - by sacramento appraisal blog

Sales volume was fairly similar to last month: Sales volume was similar to last month, and is overall approaching more normal levels (though volume is still down slightly from 2013).

Sharing Trends? It’s a huge joy to put together these graphs each month, and I hope they’re helpful for you and your contacts. If you want to share graphs online or in your newsletter, please see my sharing policy. I hope you reach out for the graphs I didn’t post here too as I’d love to make those available to you. Fill out the form above or send me an email.

Thank you for being here.

Question: How else would you describe the market? I’d love to hear your take no matter what your level of interest or knowledge is about the housing market.

If you liked this post, subscribe by email (or RSS). Thanks for being here.

Share:

  • Click to share on Twitter (Opens in new window)
  • Click to share on Facebook (Opens in new window)
  • Click to share on LinkedIn (Opens in new window)

Filed Under: Market Trends Tagged With: cash buyers, cooling values, flat median price, Home Appraiser, House Appraiser, increasing inventory, less cash investors, lower sales volume, price reductions, real estate appraisers, Real Estate Market in Sacramento, sacramento region housing market, slower real estate sales

Primary Sidebar

Connect with Ryan

 Facebook Twitter LinkedIn YouTube Instagram

Subscribe to Weekly Post

* indicates required

Search this site

Blog Categories

  • Appraisal Stuff (406)
  • Bankruptcy (3)
  • Divorce (4)
  • Estate Settlement (6)
  • FHA Appraisal Articles (56)
  • Internet (53)
  • Market Trends (476)
  • Photos from the Field (126)
  • Property Taxes (70)
  • Random Stuff (230)
  • Resources (566)
  • Videos (161)

Blog Archives: 2009 – 2019

Lundquist Appraisal Links

  • Appraisal Order Form
  • Appraisal Website
  • Rancho Cordova Appraiser Website
  • Sacramento Appraisal Blog Sitemap
  • Sacramento Real Estate Appraiser Facebook Page
  • Twitter: Sacramento Appraiser (@SacAppraiser)
  • YouTube: Sacramento Appraiser Channel

Most Recent Posts

  • The housing market nobody predicted
  • Real estate trends to watch in 2021
  • You carried me & a spreadsheet for Christmas
  • Real estate drama (and a market update)
  • Goodbye California. Is everyone leaving?
  • How much are buyers paying above the list price?
  • What would happen to the housing market if we went on lockdown again?
  • Overpricing, multiple offers, & hot ranges
  • Why your home isn’t worth 16% more today
  • Condos, halfpipes, & cooling 2-4 units

Disclaimer

First off, thank you for being here. Now let's get into the fine print. The material and information contained on this website is the copyrighted property of Ryan Lundquist and Lundquist Appraisal Company. Content on this website may not be reproduced or republished without prior written permission from Ryan Lundquist.

Please see my Sharing Policy on the navigation bar if you are interested in sharing portions of any content on this blog.

The information on this website is meant entirely for educational purposes and is not intended in any way to support an opinion of value for your appraisal needs or any sort of value conclusion for a loan, litigation, tax appeal or any other potential real estate or non-real estate purpose. The material found on this website is meant for casual reading only and is not intended for use in a court of law or any other legal use. Ryan will not appear in court in any capacity based on any information posted here. For more detailed market analysis to be used for an appraisal report or any appraisal-related purpose or valuation consulting, please contact Ryan at 916-595-3735 for more information.

There are no affiliate links on this blog, but there are three advertisements. Please do your homework before doing business with any advertisers as advertisements are not affiliated with this blog in any way. Two ads are located on the sidebar and one is at the bottom of each post. The ads earn a minor amount of revenue and are a simple reward for providing consistent original content to readers. If you think the ads interfere with your blog experience or the integrity of the blog somehow, let me know. I'm always open to feedback. Thank you again for being here.

Copyright © 2021 Sacramento Appraisal Blog