It can be a REALLY bad idea to pull comps from the other side of the freeway, but not always. Today I have some thoughts about location, comp selection, and lenders freaking out when schools are mentioned in appraisal reports.

UPCOMING (PUBLIC) SPEAKING GIGS:
11/30/23 Safe CU “Preparing for a Successful New Year”
12/08/23 Free Q&A event for appraisers only (on private work)
11am PST one hour – click link here (see pass code)
Meeting ID: 832 2414 3890 Passcode: 007
01/30/24 Joel Wright & Mike Gobbi Event 9am (on Zoom here)
2/23/24 PCAR WCR Event (details TBA)
3/11/24 Yolo Association of Realtors (details TBA)
I DON’T NORMALLY PULL COMPS ACROSS A HIGHWAY
In so many cases it’s an awful idea to cross a major road or highway to pull comps because a highway sometimes separates markets that are far different in age, square footage, lot size, architecture, price point, school district, etc….
BUT, CROSSING THE HIGHWAY DOES WORK HERE
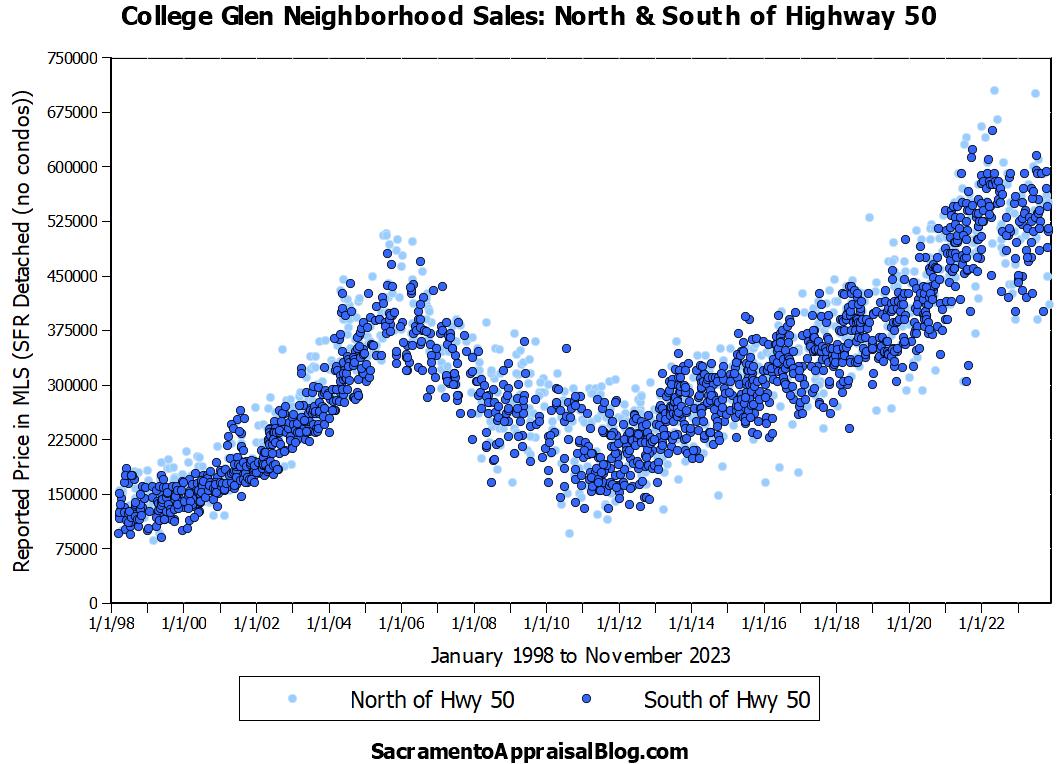
With that said, I want to show you an example of a local neighborhood where I have zero hesitation about pulling comps from both sides of the highway. The areas north and south of Highway 50 below represent the College-Glen area.

WHY IT’S NO BIGGIE TO PULL COMPS LIKE THIS:
A) Prices are similar: Prices are similar on each side of the highway. I’ve found this when pulling comps through the years, and I’ve also shown this when making graphs. I will say the north side tends to have a slightly larger square footage than the south side (same with west vs east), which is something to consider when we compare stats. But it’s still not a major difference.
B) Buyer Behavior: Buyers tend to consider each side of the highway when shopping for a home, but obviously not every buyer thinks exactly the same. That sort of uniform thinking about location doesn’t exist in the real world. I asked local Realtor Doug Reynolds for his take since he lives and works in the neighborhood. Doug said, “From my experience, I would estimate that 50-60% of the buyers are actively looking on both sides of the freeway. And 20-25% are looking only on the north side, and 20-25% are only looking on the south side.” In short, Doug’s words line up well with what I’m saying about a good chunk of the market looking at both sides simultaneously. Thus, in terms of comp selection, my goal is to be choosing comps where buyers would also choose comps.
C) The School System: Both the north and south side of the neighborhood feed into the same schools, and that can be an important factor for buyers when defining a neighborhood. For reference, the only schools in the entire neighborhood are on the south side, which gives further support that the north and south go together.
COMPARING NORTH AND SOUTH:
Here is a view of two decades of sales. The light dots are north of Highway 50 and the dark dots are south. Looks pretty similar, right?
Here’s one more way to look at it. Keep in mind there are not many sales for just one year, so don’t be dogmatic about differences. This is where size matters though since an extra 150 sq ft can affect prices (still nothing major).

BUT LET’S COMPARE WEST AND EAST TOO:
Some would argue College Greens (west of power lines) and Glenbrook (east of power lines) have different values, so let’s look at data that way too.

Here’s a graph split by west and east instead. Personally, I don’t see a huge difference, but the west side does have a larger square footage. This is still not a major difference, but let’s be aware, right?
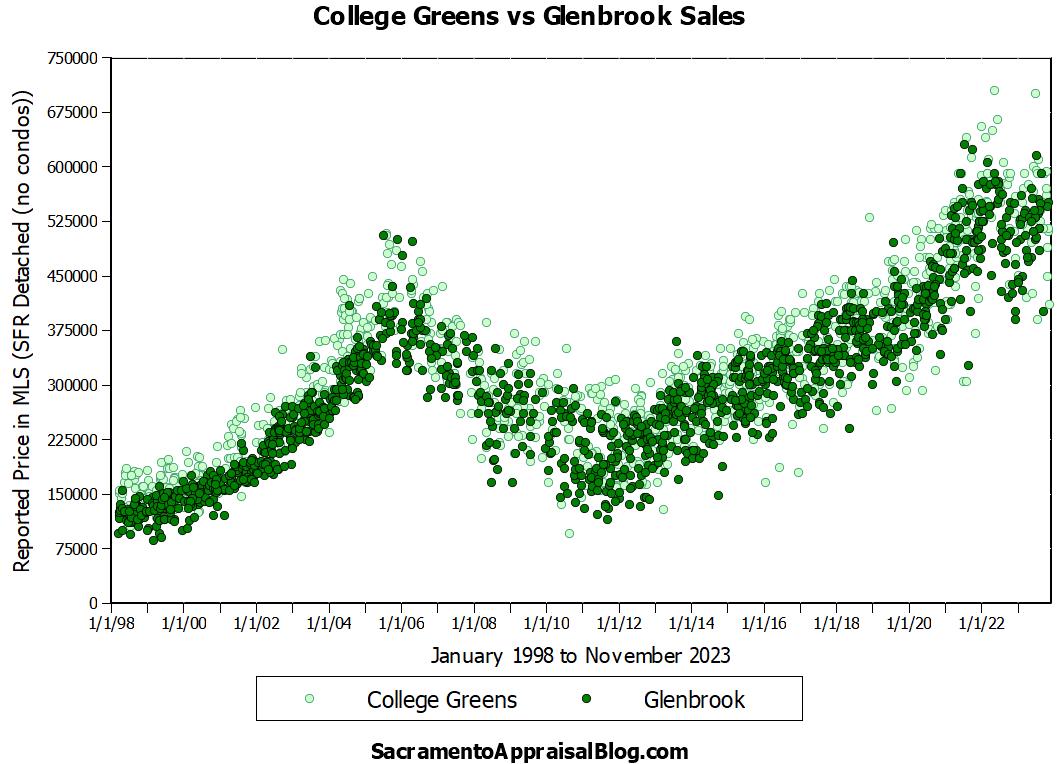
Do you see how there is slightly more of a spread in prices when looking at west vs east instead of north vs south? And the square footage difference is slightly larger too. Ultimately, this is still minor, so it doesn’t deter me from choosing comps on either side of the highway.

WHAT I’M NOT SAYING:
I’m not saying to blindly cherry-pick a higher sale across the freeway to justify a higher value. I would NOT pass up three relevant sales on the same street either for something across the highway. Ultimately, it’s dangerous in real estate when we start glossing over the most similar stuff nearby for the sake of choosing “comps” elsewhere that don’t really compete.
WHAT I AM SAYING
While it’s generally wise to NOT cross major boundaries, this example is a situation where we need to consider both sides of the highway since it’s the same neighborhood. This is a good reminder to be careful about imposing rules regarding comps. If I say, “It’s not okay to ever cross the highway,” that can end up being a very limiting lens for the way I view value. And to reiterate, I rarely cross highways, but in College-Glen, I have zero hesitation about doing so.
ADDITIONAL THOUGHTS ABOUT BIAS & SCHOOLS:
Since I mentioned schools above, I wanted to share something that’s happening to appraisers right now. These days lenders sometimes flag appraisal reports for mentioning schools or school districts because of potential bias or fair housing violations. So, what happens is an appraiser will turn in a report, and the lender goes back to the appraiser to say, “The mention of ‘school district’ could be a violation of fair lending practices.” The appraiser might have said something like, “XYZ Elementary school is two blocks away,” or “The subject property is located in the Sacramento City school district,” and the system flags for potential bias. I suspect these warnings are automated from computer programs, but I still have concerns about appraisers having to walk on egg shells when it comes to language.

Here’s the thing. School boundaries are a fact, and they can be an extremely important consideration for buyers, so knowing school boundaries as an appraiser can display geographic competence and market expertise rather than bias. Does an appraiser need to mention a school in an appraisal? Probably not. But at the same time, it feels off when the mention of a school is pegged as bias instead of factual or a display of competence. There could be an extremely relevant reason a school is mentioned too, such as, “The subject property is located directly across the street from XYZ High School.”
Look, I want to be the first to eliminate any form of bias in appraisal reports, and I take fair housing laws very seriously. I’ve written about the importance of objective language too because words matter. All I’m saying is I’m concerned about the scrutiny of language going too far. And this is being said from a guy who really takes objective language seriously.
When mentioning a school district or name of a school in an appraisal report, we’re not talking about school ratings, residents, skin color, economic background, gender, jobs, redlining, gentrification, or any other fair housing category. We certainly should not be assigning any subjective quality to the district either such as, “This is a good district” or “The schools are bad.” It’s just off-limits to say a district is “highly-sought after” too because that’s a subjective declaration. In instances like that, there should 100% be correction because the reader shouldn’t be wondering if the appraiser is inserting subjective bias in the report. In my opinion though, it becomes problematic when appraisers are being flagged for potential bias by simply mentioning a school. Moreover, my real concern is in the future if lending institutions tally up red flag instances like this where they “busted appraisers” for potential bias. Ultimately, I’d hate to see a damning report on appraisal bias for stuff that really wasn’t bias. Does that make sense? Can we have some common sense here in the midst of a commitment to objectivity and upholding fair housing laws?
Anyway, I’d love to hear your take. I’m not looking for arguments, so please direct your anger somewhere else if you can’t keep it cordial here. There are many other places to rant online.
Questions: Do you ever cross a freeway for comps? What do you think about my points above? Anything to add about schools? I’d love to hear.
If you liked this post, subscribe by email (or RSS). Thanks for being here.


 Skim or digest slowly.


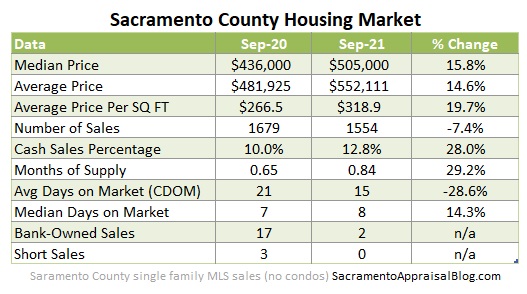


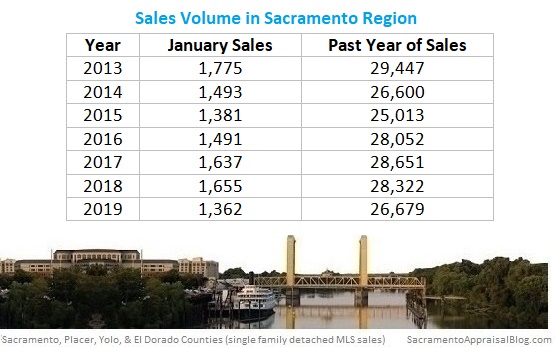
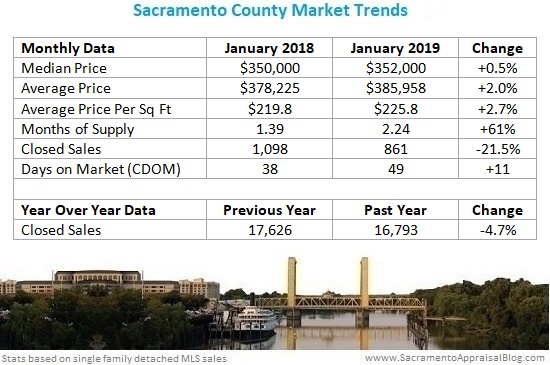
 The market is still moving faster than it should be for the time of year and stats are still just about at all-time high levels, but the market is hands-down cooler than it was a few months ago. That’s the story stats are telling and it’s absolutely what I’m hearing from the trenches of escrows.