If you don’t like what the numbers say, make them say what you want. That’s not okay, but it’s something that happens in politics, the business world, and even real estate. Do you know how to spot some of the shady tactics used to stretch the truth about numbers? Let me show you a few examples to help illustrate how small tweaks on a graph can make a big difference. I hope this will be interesting, but most of all I hope for some it will forever change the way you look at graphs. Comments and stories are welcome below.
1) SHADY TACTIC: The Y-Axis does not start at zero

TRUTH: The market has seen a normal seasonal uptick this year, but overall it’s very flat right now – unlike what the graph above shows. Notice how I began the Y-axis at 250 instead of zero. There may be some good reasons to do that on occasion, but otherwise it’s a common tactic used when trying to make a trend look more dramatic than it actually is. Keep in mind the graph below shows the same data, but with a proper Y-axis.

2) SHADY TACTIC: Compacting the second Y-Axis changed the trend

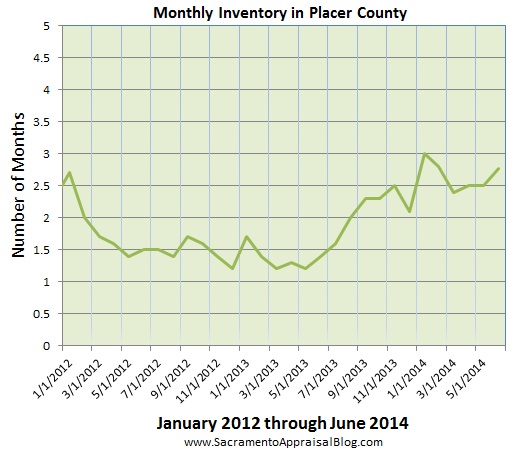
TRUTH: Inventory actually increased by 10% during this time period, but it only looks flat because I included 20 months of housing supply on the Y-axis, which essentially flattened the trend. When you manipulate the Y-axis, it can help information look much more dramatic or change the trend altogether. The image below shows that inventory is actually increasing.

3) SHADY TACTIC: The X-axis only has a few months of data (too narrow)

TRUTH: Technically sales volume has increased since January, so this is sort of a half-truth. Rather than saying volume is increasing though, the real trend is seen when we compare last year with this year because sales volume is actually down by 14% this year. When we limit the X-axis to only a few months, it can really change what we see about the market.

4) SHADY TACTIC: Data without a context can look more powerful

TRUTH: It’s true the number of REO sales has seen an increase over the past three quarters as shown with the graph above, but we’re talking about an increase of 1.3% over 9 months when looking at the total percentage of REOs vs traditional sales. This underscores how important it is to look at numbers in context of the entire market. It’s easy to think REO sales have seen a dramatic increase when viewing them in isolation, but then we see the increase only constitutes 1.3% of the market, which isn’t much to write home about.

5) SHADY TACTIC: Using quarterly or annual data to hide current trends


TRUTH: It’s definitely a good thing in real estate to look at quarterly and annual figures, and I do this all the time. But if we’re not careful, we can use larger sets of data to help obscure current trends. In the case above, the quarterly chart makes it look like values have increased the entire year in 2014, and the year-end annual stats makes it look like the market has done nothing but increase for a few years. However, when looking at monthly data below, we see a recent trend that the market has been flat for the past two months and it definitely had a lull at the end of 2013. This isn’t just about presenting data on graphs though because it’s easy to say things like, “We’ve seen incredible increases in value since 2013”, or “The median price has increased by 68% since we hit bottom in 2012”. Both statements are true and can be useful, but sometimes statements using older data are designed to help the market sound more glamorous than it is currently. Again, quarterly and annual stats are extremely valuable, but if monthly data is ignored because larger sets of data tells a more positive story, that’s not good.

Ask yourself these questions when looking at a graph:
- Does the Y-axis start at zero? If not, why not?
- Does the X-axis show enough time or is it too limited?
- Does the Y-axis crunch data too tightly or broaden it too much?
- Is there enough data on the graph to be meaningful?
Action Step: Pay very close attention to graphs you see in newspapers, on television, and online. Ask the questions above so you can think critically about the way the numbers are being presented.
Question: Any insight, questions, or stories to share? I’d love to hear your take.
If you liked this post, subscribe by email (or RSS). Thanks for being here.


 Interest rates took another slight dip last month, but really rates have been flirting with the lower 4s all year. What happens with interest rates will directly impact affordability, which really matters since values are much higher than they used to be. The market still feels fragile, so if rates shoot up too quickly, it could be bad news for values. It’s doubtful The Fed would increase rates aggressively right now, but who knows.


