It’s exhausting being a buyer because it’s so easy to get outbid. It seems like finding a house is a bit like trying to buy the new PlayStation 5. Let’s talk about that today. How much are buyers actually paying above the list price? And if you’re not local, what are you seeing in your area?
A spring market in the fall: First, here is a big market update I did for SAFE Credit Union (40 minutes). Enjoy below (or here).
QUICK SUMMARY:
- There isn’t just one amount buyers pay above the list price
- The market isn’t the same in every price range.
- We’ve seen huge growth this year between $10-20K
- About 80% of sales are somewhere between below list and $20K
- Not everything is getting bid up
- About 40% of sales sold at list price or below last month
- 2/3 of the million dollar market sells at list or below
- Higher prices tend to pay more above list (when above list happens)
- Only 3.5% of sales went $50K+ above the list price last month
- Look to the comps. Don’t just blindly offer above the list price.
SKIM OR READ IN DEPTH:
How much are buyers paying above the list price? Here are some brand new visuals to show how much buyers are paying above the list price. These might take a minute to digest. This image basically shows the total percentage of sales in the market. For instance, in the visual below 31.4% of homes last month sold below the list price, 9.9% of sales sold at the list price, etc…

Under $400K:

Between $500-750K:

Million dollar market:

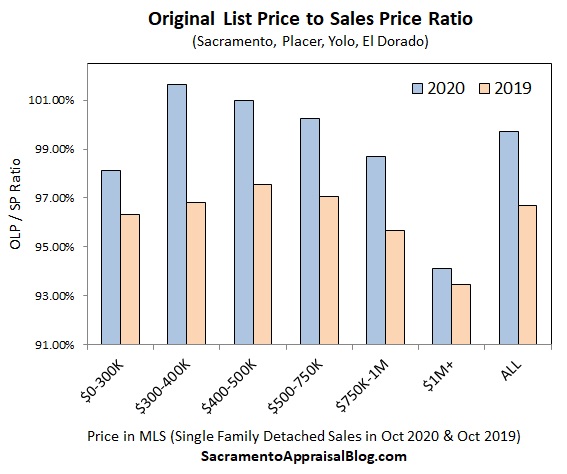
This visual compares last year with this year.

Here’s the same information but with numbers. Do you like this better?

HOW MUCH ARE BUYERS PAYING ABOVE LIST PRICE?
1) Mixed results: There isn’t just one answer that applies to every price range and escrow.
2) The biggest change: In many cases buyers are tending to pay ten to twenty thousand over the original list price to secure a contract. About one in five buyers paid $10-20K over the list price last month. In some cases prices get bid up even more, but close to eight out of ten sales are somewhere between below the list price and twenty thousand above the list price. Keep in mind many buyers are getting a loan for the full contract price, so paying above the list price doesn’t always mean buyers are bringing that much cash to the table.
3) Not everything gets bid up: It might be surprising, but this month we saw about one in three sales sell below the list price. It just goes to show sellers have to price it right – even in this wonky market. We also have to be careful about saying “EVERYTHING IS GETTING BID UP” when that’s not true.
4) Million dollar market: The highest prices basically show if buyers are paying above the list price it tends to be more significant. But two thirds of all million dollar sales last month sold at either the list price or below the list price, so the bulk of homes in this range aren’t getting bid up like the rest of the market. Like I’ve said before, this is the most overpriced segment of the market.
5) Not sensational: Only 3.5% of all sales went fifty thousand over the list price last month, so let’s be careful about shining a spotlight on this tiny sliver and saying, “Everything is getting bid up $50-100K.” Nope.
6) Don’t offer above without looking at comps: Buyers, be prepared to offer above the list price, but don’t blindly offer $10-20K above without really considering the comps and advice from your agent. Remember, the market isn’t the same at every price range either.
7) Appraisers: These days appraisers are getting huge flack for “coming in low.” Look, sometimes appraisers are legitimately missing the mark, but other times properties are getting into contract way beyond what is reasonable, so the appraisal should come in “low”. Sellers, sometimes the highest offer isn’t always the best one if there is going to be an appraisal involved. And to my appraiser colleagues, our role is never to “hit the number”, but let’s be sure to account for the true temperature of the market in our reports.
Anyway, I hope that was helpful.
Questions: What stands out to you most above? What is it like right now in the trenches for buyers? Anything stories to share? Did I miss something?
If you liked this post, subscribe by email (or RSS). Thanks for being here.


 Free webinar next week: I’m doing a big market update next week for SAFE Credit Union on November 19th from 9-10am PST.


