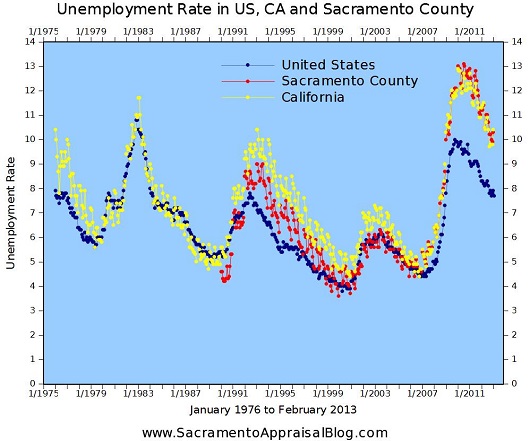
It’s time for a panoramic view. Give me a minute to explain and then spend a few moments digesting the images below. If you want to understand the Sacramento real estate market, it’s really helpful to see how certain “layers of the market” work together. These graphs help give context for how price, interest rates, inventory and unemployment mingle. Have a look below to try to make sense of what is happening with each of these metrics at any given time. For instance, when values are increasing, what is happening with interest rates and inventory? Or when values are declining, what is typically happening with unemployment or interest rates? Be sure to check out my detailed market post if you missed it a few days ago. Ultimately, what can we expect in 2014? Enjoy.


Share the Graphs: As always, you can use these images unaltered in your newsletter, on social media sites or blog posts (just link back). See my sharing policy for more details about 5 different ways to share my content.
Questions: Any thoughts? What do you see? I’d love to hear your take.
If you liked this post, subscribe by email (or RSS). Thanks for being here.




 Neighborhood Boundaries: Are the neighborhood boundaries listed in the appraisal correct? It can make a big difference if the wrong comps are used from inferior or superior neighborhoods.
 Square Footage: Is square footage in the appraisal report relatively similar to official records or to what you know to be true of the property? There are
 Upgrades: Were all improvements listed in the appraisal report and accounted for in the final value? The appraiser won’t make a dollar adjustment in the report for every single update, but the final value should consider improvements. Keep in mind of course that not all improvements contribute to value. For example, a 10-ft Yoda statue in the backyard probably won’t be a huge plus (even though you think it’s awesome).