• Skip to primary navigation
  • Skip to main content
  • Skip to primary sidebar

Sacramento Appraisal Blog | Real Estate Appraiser

Real estate appraisals for divorce, estate settlement, loans, property tax appeal, pre-listing and more. We cover Sacramento, Placer and Yolo County. We're professional, courteous and timely.

  • About
  • Appraisals
  • Order
  • Ask Ryan
  • Areas
  • Classes
  • Press
  • Trends
  • Share
  • Contact

Inventory in Sacramento

The big and little story of inventory in Sacramento

May 8, 2014 By Ryan Lundquist 6 Comments

Do you want to see the market? Let’s look at some specific price ranges in a few local counties. I know many readers are outside of Sacramento, so I’m curious if these trends are anything like your market. Overall inventory declined this past month, which is common during Spring. Properties are still selling quickly, though definitely not as fast as last year.

Quick: I suggest scrolling down to your primary county and taking a minute to digest the latest trends. Or check out my video with commentary here or below.

Sacramento County:

number of listings in sacramento - May 2014 - by home appraiser blog

months of housing inventory by sacramento appraisal blog

days on market for april 2014 by sacramento appraisal blog

Talking Point: Inventory is very thin in Sacramento County right now and properties under $300,000 are tending to sell more quickly than higher-priced listings. Remember too there are many more listings and sales in Sacramento County each month compared to many surrounding counties.

Placer County:

number of listings in PLACER county - May 2014 - by home appraiser blog

months of housing inventory in placer county by sacramento appraisal blog

days on market for placer county by sacramento appraisal blog

Talking Point: Inventory is a tad higher in Placer County compared to Sacramento County, though it is still very low. There really isn’t much for sale under $300,000 when looking at the entire market. High dollar homes are definitely taking longer to sell than the lower half of the market (which is normal).

Sacramento Region:

number of listings in Placer Sacramento Yolo El Dorado county - May 2014 - by home appraiser blog

months of housing inventory in sacramento region by sacramento appraisal blog

days on market for sacramento region by sacramento appraisal blog

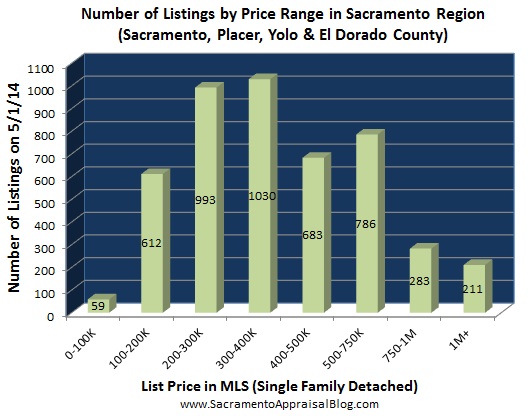
Talking Point: The higher the price, the longer it took to sell last month (generally speaking). Listings below $200,000 are definitely shrinking. Have you noticed how the quality of homes available at the low end has really changed over these past months? Options for first-time buyers to get into a good quality home under $200,000 have definitely diminished lately.

My Video: Check out my commentary on housing inventory below (or click here):

More Placer County by Request: I’ll be sharing a bit more Placer County trends in light of many requests. I’ll also be taking a wider focus at times to discuss the overall market in Sacramento, Placer, Yolo & El Dorado County. Graphs will always be clearly labeled. Sound good?

Question: What stands out to you from above?

If you liked this post, subscribe by email (or RSS). Thanks for being here.

Share:

  • Click to share on Twitter (Opens in new window)
  • Click to share on Facebook (Opens in new window)
  • Click to share on LinkedIn (Opens in new window)

Filed Under: Market Trends, Videos Tagged With: days on market, DOM, Home Appraiser, House Appraiser, housing inventory, how long are properties taking to sell, inventory in placer county, Inventory in Sacramento, months of housing supply, Placer County, Placer County Real Estate Market, regional market, Sacramento Real Estate Market, trend graphs

Seeing Sacramento real estate in chunks

April 8, 2014 By Ryan Lundquist 1 Comment

Let’s break down the market in chunks. It’s always nice to get a county-wide view of real estate, but today let’s unpack what is happening in specific price ranges in Sacramento County. I hope this will be helpful for you and your clients. When we can explain the market, we become a valuable resource and we earn people’s trust. By the way, be on the lookout for my big monthly post in two days.

1) How many properties are available at different price levels?

months of housing inventory by sacramento appraisal blog

Inventory in all of Sacramento County saw a decline from February to March as the Spring market is beginning to unfold. Housing inventory is just under 2.0 months now after being closer to 2.5 months last month. But what does inventory look like in various price ranges? As you can see, inventory is at its lowest between 200-300K, and that makes complete sense since a great bulk of buyers find this range hot and affordable (it had the most sales out of any price range). On the other and, inventory above 400K and upward really shows a dramatic increase, doesn’t it? This helps us see there are different markets within the market.

current listings vs sales in price ranges in Sacramento county - by sacramento home appraiser

Here is another way to look at inventory. You can see the number of sales in red and the number of listings in blue. Knowing the sales vs. listings ratio can open our eyes to understanding demand, marketing time, how to price properties or even how aggressive an offer might need to be.

2) How long are listings take to sell?

days on market for sacramento sales in march 2014 - by sacramento appraisal blog

On average listings are taking about 40 days to sell (or 45 days cumulative). This is about 20% longer than they were taking last year during the same time, but we all know it’s a much different market this year (more on that in two days).

3) What is happening with sales volume?

sacramento real estate market trend graph houses sold since 2008 by sacramento appraisal blog

Sales volume is definitely down from last year by over 20%, but March sales were “normal” since volume increased from February to March by 25%. The market usually sees this type of increase, so in this regard the market behaved normally.

cash sales vs conventional sales in sacramento county - by home appraiser blog

Why is sales volume down? In large part it’s because of cash investors exiting the market. As you can see in the graph above, cash sales in the first quarter of 2014 were about half of what they were in 2013 during the same time period. As investors, particularly institutional investors, have taken their foot off the gas pedal, the market is definitely feeling it. Last year the market was on “steroids” so to speak, but this year the market is in withdrawal mode trying to figure out how to live without the extra layer of cash to drive the market.

Share the Graphs? If you want to share one or two of the graphs above in your newsletter or in a blog post, go for it. Please link back here and see my sharing policy so we are on the same page about what I mean by “share” (thanks).

Questions: What image resonates with you the most? Why? Should I keep breaking the market down by price range? (I’m looking for feedback)

If you liked this post, subscribe by email (or RSS). Thanks for being here.

Share:

  • Click to share on Twitter (Opens in new window)
  • Click to share on Facebook (Opens in new window)
  • Click to share on LinkedIn (Opens in new window)

Filed Under: Market Trends Tagged With: appraisers in Sacramento, bottom of market, cash investors, decline of cash, home appraisers, housing inventory, institutional investors, inventory, Inventory in Sacramento, low sales volume, price ranges, price trends, sales stats, top of market, trend graphs, value trends

Crystal Balls, Real Estate Trends & Black Friday

December 2, 2013 By Ryan Lundquist 6 Comments

As the year fades away it’s now time for the beginning of what I call crystal ball real estate posts. What do I mean? Everyone will be speculating about what is going to happen in the 2014 market, and most posts will make very vague predictions. Since I don’t personally own a crystal ball, I’ll steer clear of some of that, yet I still want to point out some fundamentals to watch. Let’s think together below.

jobs interest rates and median sales price by sacramento appraisal blog

Watching the Layers: I keep mentioning the idea of the multi-layered real estate cake analogy. I don’t mean to be repetitive, but the gist of this analogy is that value in a real estate market is like a multi-layered cake since there are many “layers” in the market that help impact or create value. As you can see above, when “layers” like interest rates and unemployment are low, it tends to create space for values to rise. At the same time, it’s important to realize the Fed can artificially manipulate a market by lowering interest rates, which means jobs end up playing a lesser role in driving the housing market. This is definitely part of what happened with our recent real estate boom (doesn’t sound too healthy, right?).

jobs interest rates inventory and median sales price since january 2001 to 2013 by sacramento appraisal blog

Now let’s add in the extra “layer” of housing inventory. I know this is a busy graph, but spend a minute digesting what is happening here, and then I’ll make things easier on your eyes by zooming in on the trends.

jobs interest rates inventory and median sales price by sacramento appraisal blog

After years of declining values, the Sacramento market hit the bottom in the first quarter of 2012. Can you see that above? It’s important to note that as values began to increase, there was a huge drop in inventory and interest rates persisted to decline – both of which put upward pressure on home prices.

jobs interest rates inventory and median sales price since january 2011 by sacramento appraisal blog

Keys for 2014: Investors, low inventory and historically low interest rates have been the X-factor in the most recent value boom in the Sacramento area. It helps of course that the unemployment rate has been trending downward, but there is still quite a bit of healing needed for the local economy. As you can see in the graphs above, housing inventory and interest rates have begun to increase lately, which has been putting pressure on rising values. Personally I tend to think interest rates moving up a bit will matter less than what happens with inventory. Rates are still very low and their increase does make a difference with how much buyers can afford, but ultimately the market feels far more sensitive to inventory increasing. At the same time, cash purchases have been declining for two quarters, which is also helping to cool off values from an unsustainable rate of appreciation. It’s also worth mentioning that it will matter if Blackstone goes for Round 2 or not. Last year this one investment fund purchased anywhere from 1100-1500 houses (depending on whose numbers you use). They have been seemingly slowing down for the time being, but if they decide to ramp up their local focus again, it could effectively make the market more competitive by decreasing inventory.

appraisal christmas ad spoof

By the way, this is my spoof appraisal ad for Black Friday. What do you think? I posted this on my Facebook page last week for fun. My advice: Even though I want your business, don’t buy anyone an appraisal for Christmas.  🙂

Questions: Any thoughts, insight or stories to share? I’d love to hear your take.

If you liked this post, subscribe by email (or RSS). Thanks for being here.

Share:

  • Click to share on Twitter (Opens in new window)
  • Click to share on Facebook (Opens in new window)
  • Click to share on LinkedIn (Opens in new window)

Filed Under: Market Trends Tagged With: Blackstone, Blackstone in Sacramento, Home Appraiser, House Appraiser, interest rates, Inventory in Sacramento, real estate market trends, real estate trend graphs, Sacramento real estate trends, things that impact value, Unemployment Rates

How will you know when the market starts to decline?

June 13, 2013 By Ryan Lundquist 11 Comments

Property values are definitely increasing right now in the Sacramento area, but at some point in the future they’ll cool off or decline. Whenever that happens, what should we be looking for to capture the decline when it first starts? What will be the indicators of a slow down or declining trend? I asked a handful of experienced Realtors and investors in the Sacramento area, and here is what they said. Any thoughts?

Sarah Bixby - RealtorSarah Bixby – Realtor: There are 3 fairly clear indicators to show the market is in decline. Firstly, the buyer competition becomes less fierce. Instead of competing against 8-10 offers, you may only have 1 or 2 to compete with. Another sign of decline is longer DOM. If houses start sitting on the market longer this is another indicator that buyers are not purchasing or there is too much inventory available. The 3rd and most obvious indicator of a downward market is decreasing home values.

Jeff Grenz - Real Estate BrokerJeff Grenz – Broker: For my business, I look to “hits” and “phone traffic” as leading indicators. For building homes, the phone stopped ringing around 2007 for quite a while. You don’t recognize the Wile E. Coyote moment – that the business model has changed – until a few months have passed, then trends might show up in employment growth, which drives our long-term real estate market. Signs of an impending multi-year decline in the Sacramento region where government is our main industry would be some combination of two or more of these: • Major CA budget fiascos, creating layoffs, program cuts into the schools and local programs, etc. • Declines and/or slow downs in the Bay Area market, whose excess equity feeds ours. • Military action, prolonged on multiple fronts. • Hard cut offs or reversals of programs that send $$ to our market (FED quantitative easing, HARP, FHA..etc.). In most cases, these indicators will predict or precede employment, housing sales and the stats we’ll get 12-18 months later.

Eric-Peterson-Praxis-CapitalEric Peterson – Praxis Capital: I think when you’re trying to take the temperature of the market it’s as much art as it is science. We track a lot of data on a weekly basis at Praxis, and to me the best indication of a declining market is inventory. When you start to see that number grow you know you’ve got a market with more people selling than buying and that is inevitably going to affect pricing in an adverse way. That’s the science side. As far as the art of understanding market trends, I pay very close attention to what our resale agents are saying about the homes we have on market. Are they getting a lot of phone calls? Is traffic good? How are our days on market? These clues are often the leading indicators to where the market is going and will often signal a declining market well before the data lets you know something is wrong.

Zoritha May-ThompsonZoritha Thompson – Broker: My key Indicator of a slow in the market would be inventory of homes for sale. Currently with a lack of inventory, buyers are scrambling just trying to purchase a home and are making offers over the list price, which in turn makes prices increase. When there is more inventory it becomes more competitive and keeps prices level or may move prices lower. Prime example would be if the hedge funds put their inventory of homes on the market at the same time, this could cause prices to move downward. Another key indicator would be “Days on market” (DOM) climbing higher which means the market has reached a peak and may be coming down. I have been seeing a slight trend of homes coming on the market that are way over priced, they are just sitting there with no offers.

Warren Adams - RealtorWarren Adams – Realtor: I believe today’s market is strongly dictated by low inventory and interest rates. An increase in interest rates will also increase inventory and most likely put us back to a more “normal market”. Today’s MLS notes that there were 122 new listings with the last 24 hours and 158 pending sales in the same time period which shows homes continue to sell quicker than they are coming in.

What does the data say? These are fantastic responses above, and the two graphs below help illustrate how inventory and DOM (days on market) can help show what a market is doing (declines in both have been indicative of increasing values).

days on market in Sacramento County - Graph by Trendgaphix Description by Sacramento Appraisal Blog

months of inventory in sacramento county May 2011 to May 2013

Questions: Do you think the decline will be well publicized when the market does take a turn? With the massive use of social media, will the media and real estate community catch it (and report it) when it begins to happen?

If you liked this post, subscribe by email (or RSS). Thanks for being here.

Share:

  • Click to share on Twitter (Opens in new window)
  • Click to share on Facebook (Opens in new window)
  • Click to share on LinkedIn (Opens in new window)

Filed Under: Market Trends, Resources Tagged With: days on market, DOM, Eric Peterson - Praxis Capital, Home Appraiser, House Appraiser, Inventory in Sacramento, market trends in Sacramento, metrics to watch, real estate metrics, Sarah Bixby - Realtor, signs of a declining market, Warren Adams - Realtor, Zoritha Thompson

  • Go to page 1
  • Go to page 2
  • Go to Next Page »

Primary Sidebar

Connect with Ryan

 Facebook Twitter LinkedIn YouTube Instagram

Subscribe to Weekly Post

* indicates required

Search this site

Blog Categories

  • Appraisal Stuff (407)
  • Bankruptcy (3)
  • Divorce (4)
  • Estate Settlement (6)
  • FHA Appraisal Articles (56)
  • Internet (53)
  • Market Trends (481)
  • Photos from the Field (126)
  • Property Taxes (70)
  • Random Stuff (231)
  • Resources (566)
  • Videos (161)

Blog Archives: 2009 – 2021

Lundquist Appraisal Links

  • Appraisal Order Form
  • Appraisal Website
  • Rancho Cordova Appraiser Website
  • Sacramento Appraisal Blog Sitemap
  • Sacramento Real Estate Appraiser Facebook Page
  • Twitter: Sacramento Appraiser (@SacAppraiser)
  • YouTube: Sacramento Appraiser Channel

Most Recent Posts

  • How long can this market keep going?
  • What is your housing persona?
  • Rapid price growth & the Gilmore Girls next door
  • Are first-time buyers targeting 2-4 unit properties?
  • Stale real estate headlines & buyers flocking to El Dorado County
  • My new sewer line adds huge value, right?
  • The housing market nobody predicted
  • Real estate trends to watch in 2021
  • You carried me & a spreadsheet for Christmas
  • Real estate drama (and a market update)

Disclaimer

First off, thank you for being here. Now let's get into the fine print. The material and information contained on this website is the copyrighted property of Ryan Lundquist and Lundquist Appraisal Company. Content on this website may not be reproduced or republished without prior written permission from Ryan Lundquist.

Please see my Sharing Policy on the navigation bar if you are interested in sharing portions of any content on this blog.

The information on this website is meant entirely for educational purposes and is not intended in any way to support an opinion of value for your appraisal needs or any sort of value conclusion for a loan, litigation, tax appeal or any other potential real estate or non-real estate purpose. The material found on this website is meant for casual reading only and is not intended for use in a court of law or any other legal use. Ryan will not appear in court in any capacity based on any information posted here. For more detailed market analysis to be used for an appraisal report or any appraisal-related purpose or valuation consulting, please contact Ryan at 916-595-3735 for more information.

There are no affiliate links on this blog, but there are three advertisements. Please do your homework before doing business with any advertisers as advertisements are not affiliated with this blog in any way. Two ads are located on the sidebar and one is at the bottom of each post. The ads earn a minor amount of revenue and are a simple reward for providing consistent original content to readers. If you think the ads interfere with your blog experience or the integrity of the blog somehow, let me know. I'm always open to feedback. Thank you again for being here.

Copyright © 2021 Sacramento Appraisal Blog