Did you hear about the 100 million dollar condo sale in New York recently? It’s hard to grasp just how much money that is for only one residence. For context, $100,000,000 is about a 19% ownership of the Sacramento Kings, a 10% share of the San Francisco Giants, or a 20% ownership of the Oakland A’s (Forbes). After reading about this sale from New York appraiser Jonathan Miller, and seeing his “tall” graph of the New York market, I was inspired to do something similar.
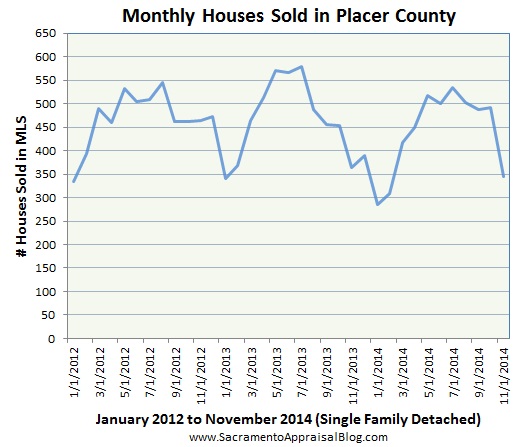
The Tallest Real Estate Graph Ever in Sacramento: From what I can tell, the image below is the tallest real estate graph ever in Sacramento. This is a unique view of the residential housing market from 2012 through 2014. What do you see?

The Small Version of the Graph Above:

Sales Above $1M in Sacramento County Since 2008:

When we look at the market in different ways, sometimes we can better understand it and then explain it to clients. I hope this was helpful and interesting. As always, feel free to share this post with your contacts, and if you plan to post a graph on your site or in your newsletter, please see my sharing policy (it’s an honor when people share – thanks).
Question: What do you see in the graphs above?
If you liked this post, subscribe by email (or RSS). Thanks for being here.

 3) The Reality of Less Cash: We no longer have a foreclosure epidemic both locally and nationally, which means there are fewer houses being flipped. Thus a rule like this carries far less impact in today’s market compared to the beginning of 2010 when it was absolutely beneficial. For reference, when FHA first eased their 90-day rule in 2010,

 The Small Distressed Sales Pond: Foreclosures and short sales used to drive the market, but that’s not the case any longer these days. Being a distressed property specialist is still a relevant avenue of business, but it’s also a crowded pond to fish in. Remember that owners who went through a foreclosure or short sale several years ago may actually now be able to re-enter the market (these buyers are called “Boomerang Buyers”).
 Divorce: As the economy improves, divorce has been more common (




 It took one more day last month to sell a house compared to the previous month (10 more days since July 2014). It’s important to be in tune with the trends of each price range too since the market is not the same at each segment.


