Pricing low on purpose can be a triggering issue. I know both buyers and agents can get extremely frustrated to have to enter a bidding war. And let’s not even talk about auction platforms. But pricing low is pretty much the norm in the Bay Area. People have always told me that, and I finally looked into it since I gave a presentation last week in San Francisco. Anyway, I have some cool stuff to share today, and I hope you get something out of this (whether you’re local or not).
What pricing strategy do you like? Really low to create a bidding war? Just below market value? At market value? Above market value?

UPCOMING (PUBLIC) SPEAKING GIGS:
11/16/23 Mega Agent Panel (register here)
11/30/23 Safe CU “Preparing for a Successful New Year”
01/30/24 Joel Wright & Mike Gobbi Event 9am (on Zoom here)
MY HALLOWEEN COSTUME
I had a real estate costume for Halloween called “Low-Rate Larry.” Here it is in case you wanted to see it. Hope you had a safe day yesterday.
STRATEGIC UNDERPRICING TO GET BID UP?
Here’s a really straightforward way to compare Sacramento and the Bay Area, and then I’ll show you some chaotic graphs below that drive home the point even more. Keep in mind some individual Bay Area counties like Alameda had over 70% of sales go above the original list price last month, but other counties such as Solano, Napa, and Sonoma are actually lower than Sacramento. Ultimately, when we put all Bay Area counties together, this is what the stats look like.

MASSIVE DIFFERENCE BETWEEN SAC & BAY AREA
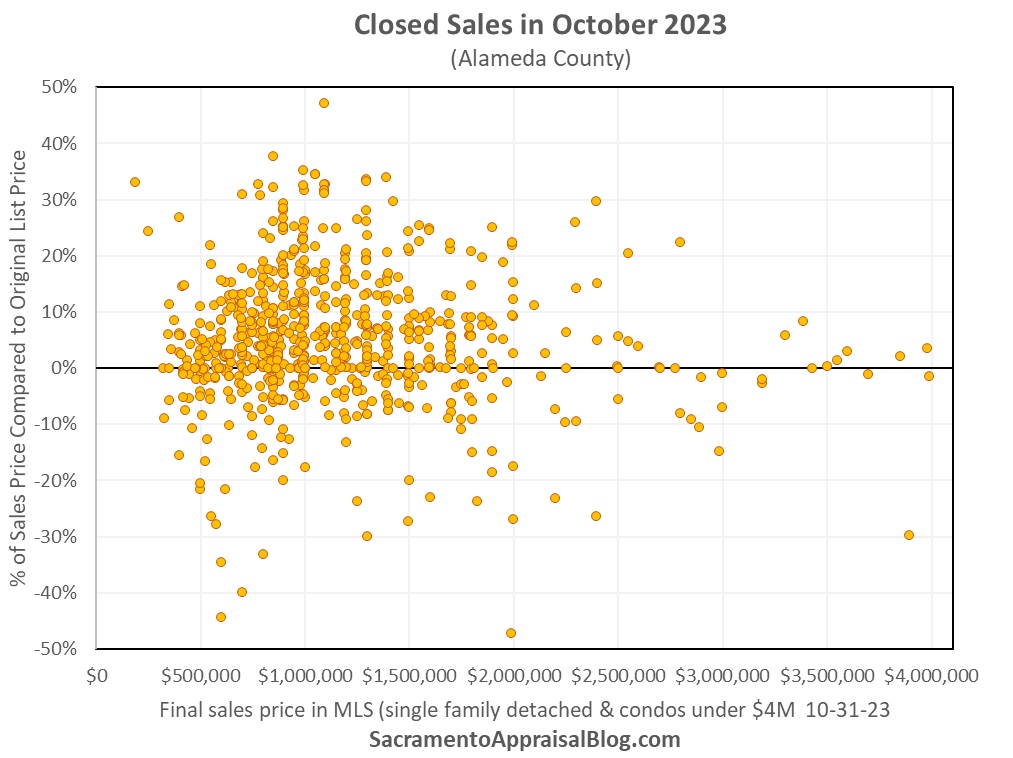
I know these visuals are crazy, but I want to show how different the pricing trend is in the Bay Area. The dots represent how properties sold compared to the original list price. Anything above 0% went above, and below 0% went below. Obviously, prices are way different in the Bay Area, but it’s clear there are many more properties going above the original list price.

And here’s a way to look at the same data, but with days on market. It also looks like the bulk of bidding up in Sacramento is during the first week, but at least portions of the Bay Area have about an extra week (see individual counties below). I’d have to study more than just one month to call this a trend, but I welcome any Bay Area locals to speak into this. How long is the window before a property typically goes pending?

10% ABOVE THE LIST PRICE
In Sacramento this month we saw 2.3% of all sales go 10% or more above the original asking price, but in the Bay Area that was 19.8%. It’s a stunning stat to think one in five sales went at least 10% above in the midst of a fall season with higher mortgage rates. Yet, it’s not just the market because pricing lower yields stats like this. When looking at 20% above, 0.3% of sales in Sacramento went 20% above in October, but that was 7.1% in the Bay Area.
BAY AREA DOMINATING CALIFORNIA
Here is a visual from CAR to show homes selling above the asking price in California. Check out the first five counties to see the Bay Area dominating the list. Like I said, Napa, Sonoma, and Solano aren’t as extreme, so when we put these counties into the mix, it waters down some of the data so to speak.

CLOSING THOUGHTS
There is clearly a different pricing strategy in the Bay Area compared to Sacramento, and buyers pretty much expect to have to enter a bidding war. I’ve heard this consistently from the real estate community, Bay Area buyers, and the stats support the idea too. Someone the other day on Twitter (X) told me this dynamic began in the 1990s, but I’d love to hear from any insiders who have the skinny. My price visuals below show a massive increase in prices in the later 90s in the Bay Area, so I wouldn’t be surprised to hear a different pricing strategy took off then, but I’d defer to local experts on that. For locals, do you think pricing low is a thing? When did it begin? Why is it this way?
NOT EVERYTHING GOES ABOVE
When talking to real estate professionals online, one would think literally every property in the Bay Area goes above the asking price, but that’s not what the stats show (my stats or CAR stats). Granted, in my experience, when we get around 60-70% of the market going above the asking price, it’s honestly hard to see stuff that’s selling below without pulling exhaustive stats, so I truly get the sentiment. I’ve definitely had conversations like this in Sacramento when are stats were 60-70% above.
APPRAISERS
We have to be really intentional about staying objective. The original list price might not reflect value at all, so going above could simply be the byproduct of a pricing strategy more than anything. I suspect Bay Area appraisers are particularly in tune with this since the dynamic of pricing low is a thing. Granted, going too far above actual value was something we saw on a massive scale in 2021, so there is absolutely such a thing as going too high. For any onlookers, it’s more challenging today to value properties since we have so many missing sales. If volume in Sacramento is down by 40%, that means we have 40% fewer comps.
DEAR REAL ESTATE AGENTS IN BOTH PLACES
If you relocate to Sacramento from the Bay Area, it’s important to recognize the pricing trend is not the same here. Properties in Sacramento tend to be priced closer to market value in many cases (not always). I’m just saying only 2.3% of sales went above 10% last month compared to a whopping 19.8% in the Bay Area. In other words, it’s a different vibe in Sacramento (but still competitive). Also, if you’re an agent from the Bay Area taking listings in Sacramento, you don’t have to price 10-20% low to get into contract. I’m not trying to tell anyone what to do. I’m just saying the pricing culture is different. Likewise, if you’re a Sacramento agent taking a Bay Area listing, my recommendation is to fit into the pricing culture there. Look to the comps to understand the market, and pay close attention to the way recent sales and pendings have been priced, and act accordingly. Ultimately, it can be a real mistake to project the trend from another location on a local market (even if that other place is only two hours away).
MORE VISUALS FROM MY PRESENTATION:
PRICE VISUALS
Here’s some stuff from my presentation this week. One thing to note about Bay Area prices is how much they departed from California in the later 90s. What do you make of that? Tech boom?


OTHER VISUALS
And here are more visuals I made this past week. In some of the Bay Area images I included condos too. Let me know if you have any insight or questions.


Thanks for being here.
Questions: What do you think of pricing low on purpose? What stood out to you most about the visuals or stats? Am I missing something? I’d love to hear.
If you liked this post, subscribe by email (or RSS). Thanks for being here.


 The stats have been glowing for months in Sacramento County, but last month we finally saw a dip in prices. In short, the glowing stats are now showing a slowing. But that’s not really a surprise because


