• Skip to primary navigation
  • Skip to main content
  • Skip to primary sidebar

Sacramento Appraisal Blog | Real Estate Appraiser

Real estate appraisals for divorce, estate settlement, loans, property tax appeal, pre-listing and more. We cover Sacramento, Placer and Yolo County. We're professional, courteous and timely.

  • About
  • Appraisals
  • Order
  • Ask Ryan
  • Areas
  • Classes
  • Press
  • Trends
  • Share
  • Contact

Sacramento County Real Estate

Addicted to low rates, sending 2x4s, and a market update

March 14, 2018 By Ryan Lundquist 5 Comments

The market feels addicted to low interest rates. So what’s going to happen when rates rise? Let’s travel back to the late 70s for some insight and consider a few thoughts. Then I have a huge local market update for those interested.

A few thoughts about interest rates:

1) Addicted: We have a market that feels addicted to low rates. I guess that’s understandable since rates have been hovering around 4% for the past 6 years. On one hand it seems silly that buyers would freak out about rates near 4.5% because that’s historically low, but at the same time the market is sensitive about rate changes because we’ve become accustomed (or addicted) to low rates. Let’s remember rate changes can make a bigger difference at lower prices too because they can more readily impact affordability.

2) They used to be 18%: Some people say, “You kids are so lucky because when I bought my first house the interest rate was 18%.” There’s some truth there and let’s be in tune with history, yet prices used to be substantially lower too. You bought at 18%, but the price was $112,000.

3) Not the only factor: What interest rates do can end up impacting affordability, sales volume, housing supply, and prices. Check out a deep article by Freddie Mac to read through some of the potential changes coming. Yet let’s remember interest rates are not the only factor for housing. There are many other layers of the market that end up influencing value. We can’t forget about the job market, economy, a housing shortage, financing, creative loans, new construction, cash investors, etc… In short, interest rates are a big factor for the market, but they are not the only factor either. One more thing. Nobody knows the future. While it looks like rates are going to be increasing more, we could be saying something entirely different next year.

When rates doubled from 1977 to 1981 (from Freddie Mac):

1) Mortgage origination fell by 40%.
2) Annual single family home sales volume dropped by 36%.
3) New construction dropped by 51%.

History teaches us a huge change in rates can absolutely sway the market. Obviously an uptick from 4% to 4.5% is not the same thing as 1977, but the effect then reminds us to keep an eye on mortgage origination, sales volume, and new construction (and prices).

I hope that was interesting or helpful. Anything to add?

–——-——- Big monthly market update (it’s long on purpose) ———–——-

It’s starting to look like Spring. Prices are picking up, it took two less days to sell last month, and more listings are hitting the market. It was actually the strongest February of sales volume we’ve seen since 2013. The market has an aggressive feel with multiple offers (when properties are priced correctly), yet in some neighborhoods it almost seems like values have been a bit flat or subdued. Thus it’s a good reminder the market can feel aggressive sometimes without absolutely insane value increases. Keep in mind there are about 100 price reductions every day right now in MLS, and that means buyers are not willing to pay any price despite a housing shortage.

Sales volume is down (barely): There is lots of talk in the media about how sales volume is slumping nationally and is down 3% or more, but it’s only down 0.28% this year in the region compared to last year. It’s actually up from two years ago, which a big point in my mind. In Sacramento County sales volume is down nearly 1.5%, which is about where it’s been hovering lately. This isn’t a red flag for the market, but it would be if sales volume really started to slough. Moreover, knowing that rising interest rates can impact sales volume, this is important to watch over time.

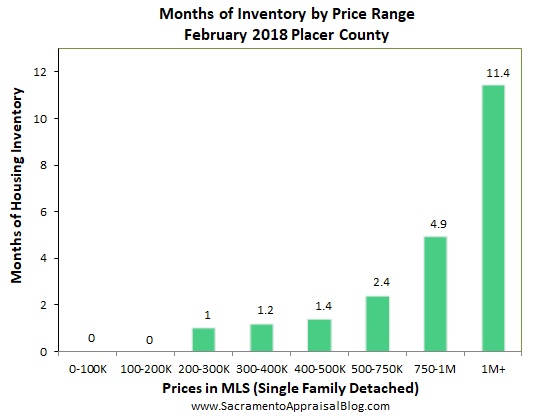
The bottom vs. top: The bottom of the market has less inventory, more competition, and more upward pressure than the top. The highest prices above $1M have over a year’s worth of homes for sale. It’s actually fairly normal to have that much inventory at the high-end, though this month is a bit higher than the same time last year, so let’s keep watching that. Part of having so many listings at higher prices though is sellers are pricing at absurd levels that are totally disconnected from the market. It’s like everyone and their Mom wants to sell for $3M when very few sales in Sacramento fetch those types of prices.

Advice for sellers: Pay careful attention to similar properties that are actually selling in the neighborhood rather than overpriced listings. In other words, price according to the comps and listings that are getting into contract rather than listings that don’t really reflect the market. And don’t use price per sq ft to price your home either.

RENTS: I’ve been focusing more on rents and I’ll keep doing that if people like it. I have a rent folder in the download link below too (data from Yardi Matrix).  

I could write more, but let’s get visual instead.

DOWNLOAD 70 graphs HERE: Please download all graphs here as a zip file. See my sharing policy for 5 ways to share (please don’t copy verbatim).

SACRAMENTO COUNTY (more graphs here):

SACRAMENTO REGION (more graphs here):

PLACER COUNTY (more graphs here):

DOWNLOAD 70 graphs HERE: Please download all graphs here as a zip file. See my sharing policy for 5 ways to share (please don’t copy verbatim).

Questions: How do you think rising rates will impact the market over time (if they do keep rising of course)? Anything I missed? I’d love to hear your take.

If you liked this post, subscribe by email (or RSS). Thanks for being here.

Share:

  • Click to share on Twitter (Opens in new window)
  • Click to share on Facebook (Opens in new window)
  • Click to share on LinkedIn (Opens in new window)

Filed Under: Market Trends Tagged With: appraisals in Sacramento, House Appraisal, housing inventory, housing shortage, images of sacramento market, increasing values, Placer County real estate trends, Sacramento County Real Estate, sacramento home apraiser, Sacramento real estate trends, Sacramento Region real estate trends, sales volume, trend graphs

The myth of the collapsing market (and a big Sacramento market update)

September 13, 2017 By Ryan Lundquist 4 Comments

Positive real estate news is sexy. It gets clicks. It makes us feel good. And we love sharing it. But what happens when the market cools? Well, it’s not always easy to digest. In fact, lots of people freak out and think the market is starting to tank when it’s actually just doing its normal thing of slowing. Today let’s talk about the danger of embracing the collapsing market myth, and then take a deep look at the slowing Sacramento market. Any thoughts?

The myth of the collapsing market: The market tends to slow down around this time of year. Just as the weather changes, so does the real estate market. The kids go back to school, sales volume usually starts to slide, inventory goes up, and prices soften. Yet despite this happening nearly every single year, we hear things like, “The market is beginning to take a big turn” or “The ‘bubble’ has finally popped.” Case-in-point, I watched a video a few weeks back from a national show that said new construction home prices in Texas were beginning to take a turn, and that the Texas market was six months ahead of everyone else. Maybe this show is correct, but my problem is the host made a huge sweeping market statement based on a VERY minor dip in prices from June to July. I suppose I could do the same in Sacramento since the median price dipped 1% last month. The truth is we’ll see many more articles like this in coming months because we tend to confuse a seasonal softening with a big market turn. It’s like we forget the market is cyclical at this time of year.

My advice? Cut through the hype and know the seasonal market wherever you are located in the United States. What does the market normally do at this time of year? What normally happens to prices, sales volume, and inventory? Understanding what a slowing season tends to look like can help us give advice to friends and clients, and we can avoid saying the market is tanking just because prices dipped last month. Of course at some point the market really could collapse, but unless we are seeing symptoms beyond a normal seasonal slowing, it’s probably okay to be cautious of a doom & gloom housing message.

I hope that was helpful or interesting. Any thoughts?

–——-——- Big monthly market update (it’s long on purpose) ———–——-

The stats have been glowing for months in Sacramento County, but last month we finally saw a dip in prices. In short, the glowing stats are now showing a slowing. But that’s not really a surprise because we all felt this slowing in the market for the past 30-60 days. It’s just we didn’t see it show up in the sales stats until now. After all, it takes a month or two to see slower pendings close escrow. Anyway, the median price dipped by about 1%, inventory increased, and most importantly it took 3 days longer to sell last month than the previous month. I know, there are still multiple offers and there is still upward pressure in some areas and price ranges. I get that. Remember, the market is slowing, but that does not mean it is dull or slow. Ultimately when looking at price metrics, the market is up anywhere from 7-9% from last year, and sales volume is about the same as last year too, which shows the market is trying to normalize. Housing inventory in the region is about 10% lower than it was last year at the same time, which reminds us that the market is still more aggressive compared to last year. Lastly, if the market was collapsing, I’d suspect we would be seeing a big change in the psyche of buyers, a big change in inventory, and a big change in sales volume. Not that the market has to tank the same way all the time, but if values were turning we’d likely expect to see something much more out-of-the-ordinary beyond all the normal seasonal stuff we’re seeing right now.

DOWNLOAD 66 graphs HERE: Please download all graphs in this post and more here as a zip file (includes a stat sheet too). See my sharing policy for 5 ways to share (please don’t copy verbatim).

SACRAMENTO COUNTY (more graphs & stats here):

SACRAMENTO COUNTY STATS:

  1. The median price is currently $348,000 and dipped 1% last month.
  2. The median price is 7.6% higher than the same time last year.
  3. Sales volume in August was 4.7% lower this year than 2016. There were 1668 single family detached sales last month.
  4. It took an average of 24 days to sell a home last month (one year ago it was taking 2 days longer).
  5. The median days on market last month was 12 days, which means properties are selling quickly.
  6. It took 3 more days to sell in August compared to July (median days).
  7. FHA sales were 22.6% of all sales last month in the county.
  8. Only 0.8% of sales last month were bank-owned & 1.5% were short sales.
  9. The avg price per sq ft was about $223, which is slightly higher than last month (8.7% higher than last year).
  10. The avg sales price decreased about 1.5% last month and is currently $378,885. This is 6.8% higher than last year.
  11. Cash sales were 12.5% of all sales last month.

SACRAMENTO REGION (more graphs & stats here):

SACRAMENTO REGION STATS:

  1. The median price is $389,900 and declined slightly last month.
  2. The median price is 9% higher than the same time last year.
  3. Sales volume in August was 0.2% higher this year than 2016. There were 2771 single family detached sales last month.
  4. It took an average of 28 days to sell a home last month (one year ago it was taking 3 days longer).
  5. The median days on market last month was 13 days, which means properties are selling really quickly.
  6. The median days on market increased by 2 days last month, which helps shows a slowing in the market.  
  7. FHA sales were 18.1% of all sales last month.
  8. Only 0.8% of sales last month were bank-owned & 1.48% were short sales.
  9. The avg price per sq ft was about $227, which is the same as last month (7.9% higher than last year).
  10. The avg sales price declined slightly last month and is currently $430,101. This is 8.6% higher than last year.
  11. Cash sales were 14% of all sales last month.

PLACER COUNTY (more graphs & stats here):


PLACER COUNTY STATS:

  1. The median price is currently $462,000 and increased about 2% last month (but still down from a couple months ago).
  2. The median price is 7.4% higher than the same time last year.
  3. Sales volume in August was 14% higher this year than 2016. There were 637 single family detached sales.
  4. It took an average of 30 days to sell a home last month (one year ago it was taking 10 days longer).
  5. The median days on market last month was 15 days, which means properties are selling really quickly.
  6. The median days on market increased by 3 days last month, which helps shows a slowing in the market. 
  7. FHA sales were 12.5% of all sales.
  8. There were only 2 bank-owned sales last month and only 9 short sales.
  9. The avg price per sq ft was $229, which is slightly higher than last month (7.4% higher than last year).
  10. The avg sales price increased about 0.5% last month and is currently $508.686. This is 7.7% higher than last year.
  11. Cash sales were 14.4% of all sales last month.

DOWNLOAD 66 graphs HERE: Please download all graphs in this post and more here as a zip file (includes a stat sheet too). See my sharing policy for 5 ways to share (please don’t copy verbatim).

Questions: What are you seeing out there? What signs of slowing have you noticed? Did I miss anything? I’d love to hear your take.

If you liked this post, subscribe by email (or RSS). Thanks for being here.

Share:

  • Click to share on Twitter (Opens in new window)
  • Click to share on Facebook (Opens in new window)
  • Click to share on LinkedIn (Opens in new window)

Filed Under: Market Trends Tagged With: appraiser in Sacramento, competitive market, Home Appraiser, house appraisers, low inventory, Placer County real estate, prices softening, real estate graphs, real estate stats, Sacramento County Real Estate, sacramento regional housing market, slowing market, slowing real estate market, trend graphs

Insane value increases (not really) and Facebook real estate trends

March 14, 2017 By Ryan Lundquist 5 Comments

The market has been showing insane value increases. Well, on paper it looks that way, but in reality that’s not what we’re seeing right now. Let’s take a deep look at the market today and also consider real estate trends we can glean from Facebook statuses. This big monthly post is long on purpose. You can scan it quickly or pour a cup of coffee and spend some time here. If you aren’t in Sacramento, I hope you can still find some value. Do you see any parallels to your market? Any thoughts? 

Three real estate trends we can glean from Facebook:

1) Asking for inventory: I am seeing many posts from real estate agents saying, “I have buyers, but there aren’t any homes on the market”, or “Do you have any upcoming homes in XYZ city or neighborhood?”, or “There are only 11 listings in the entire zip code.” Even if we didn’t have actual numbers to show inventory is sparse, we could pick up on this reality by some of what we see on Facebook. This is a good reminder that data is not just about looking at sales. 

2) Asking for rentals: Many in the real estate community and the general public are asking for rental inventory on social media. There are so many posts from tenants needing to find a home or agents and loan officers asking on behalf of someone. A person I know recently posted about trying to rent a home in Roseville only to have to compete with 23 other contracts on one house.

3) Announcing price improvements: This market is “hot”, but buyers are not biting on absurdly overpriced listings. This is why we still see Facebook posts telling of price reductions or “price improvements” (a softer way of saying the same thing). You might think we wouldn’t see such a thing in a “crazy hot” market, but we do.

4) What is #4?

———————- big monthly market update below ———————-

DOWNLOAD 70 graphs HERE: Please download all graphs in this post (and more) here as a zip file (including a one-page quick stat sheet). See my sharing policy for 5 ways to share (please don’t copy verbatim). Thanks.

A MARKET SUMMARY:

Last month values increased no matter how we look at it. The median price, average sales price, and average price per sq ft all increased in Sacramento County, Placer County, and the region. This isn’t a surprise though because it’s what tends to happen in the spring. The mistake we can easily make though is to look at the median price rising nearly 5% last month and say things like, “Values increased by 5%.” Thus if we’re not careful we might claim values are increasing rapidly when in reality they simply got back to where they were at the height of summer before a lull in the fall.

While the market is said to be “hot” in the “Farm to Fork Capital of America”, let’s still remember the market is not doing the same thing at every price level. Inventory is incredibly sparse under $400,000, and that is putting tremendous pressure on values to increase, but in some higher price ranges and neighborhoods the market feels a bit flat. Yes, there are multiple offers on about anything that is priced right, but still we have to not confuse the aggressive feel of the market with rapid appreciation. In short, at the moment we are not seeing the type of rapid appreciation we had in 2013 at the height of the glory days of Blackstone. In all of this let’s remember too we’ve had value increases without much wage growth. Let’s keep rooting for wages and the economy to drive the market instead of anemic inventory and low interest rates. 

Lastly, let’s remember the bulk of listings in 2016 hit the market between April and August, so my advice to buyers is to keep waiting for inventory to come (many buyers are feeling hopeless). I would advise sellers to price according to other properties that are actually getting into contract too instead of sensational real estate headlines.

SACRAMENTO COUNTY:

  1. The median price increased to $323,500 (8.2% above February 2016).
  2. The median price rose 6% last month, but values were basically getting back to summer after a lull in the fall, so this doesn’t mean values increased by 6% in one month.
  3. Sales volume in February 2017 was just about 1% higher than last year.
  4. It took an average of 44 days to sell a home last month (one year ago in February 2016 it was taking 2 days longer to sell).
  5. It took two days longer to sell in February compared to January (next month we should see stats show less days on market as spring unfolds).
  6. FHA sales volume is down 6% this year compared to 2016 (but roughly 25% of all sales were FHA last month).
  7. Only 3.8% of all sales were bank-owned and 2.3% were short sales.
  8. The average price per sq ft was about $204 last month (about 2% higher than January, but 8% higher than last year).
  9. The average sales price increased about 2.5% last month and is currently $348,892. This is 7.7% higher than last year.
  10. Cash sales were 15% of all sales last month.

Some of my favorite images this month:

Median price since 2013 in sacramento county

price metrics since 2015 in sacramento county - look at all

inventory in sacramento county Since 2008 - by sacramento appraisal blog

inventory - February 2017 - by home appraiser blog

CDOM in Sacramento County - by Sacramento Regional Appraisal Blog

sales volume in Sacramento County since 2012

january seasonal market in sacramento - 2

SACRAMENTO REGIONAL MARKET:

  1. The median price increased to $355,600 (7.7% above February 2016).
  2. The median price rose 4.8% last month, but values were basically getting back to summer after a lull in the fall, so this doesn’t mean values increased by 4.8% in one month.
  3. Sales volume in February 2017 was about 2% higher than last year. Sales volume in the region is up nearly 3% this year so far.
  4. It took an average of 48 days to sell a home last month (one year ago in February 2016 it was taking 3 days longer to sell).
  5. It took one day longer to sell in February compared to January (next month we should see stats show less days on market as spring unfolds).
  6. FHA sales volume is down 6.7% this year compared to 2016 (but roughly 22% of all sales were FHA last month).
  7. Only 3.4% of all sales were bank-owned and 2.5% were short sales.
  8. The average price per sq ft was about $210 last month (about 1% higher than January, but 7% higher than last year).
  9. The average sales price increased about 2% last month and is currently $387,105. This is 4.3% higher than last year.
  10. Cash sales were 16% of all sales last month.

Some of my favorite images this month:

Regional Inventory - by Sacramento regional appraisal blog

inventory in sacramento regional market

days on market in placer sac el dorado yolo county by sacramento appraisal blog

sacramento region volume - FHA and conventional - by appraiser blog

median price and inventory in sacramento regional market 2014

Regional market median price - by home appraiser blog

PLACER COUNTY:

  1. The median price increased to $435,000 (4.8% above February 2016).
  2. The median price rose 2.5% last month, but values were basically getting back to summer after a lull in the fall, so this doesn’t mean values increased by 2.5% in one month.
  3. Sales volume in February 2017 was about 9% higher than last year.
  4. It took an average of 51 days to sell a home last month (one year ago in February 2016 it was taking 7 days longer to sell).
  5. It took 1 less day to sell in February compared to January.
  6. FHA sales volume is down 12.6% this year compared to 2016 (but roughly 17% of all sales were FHA last month).
  7. Only 2.5% of all sales were bank-owned and 3.1% were short sales.
  8. The average price per sq ft was about $219 last month (about 3.9% higher than January and 4.8% higher than last February).
  9. The average sales price increased about 2.4% last month and is currently $478,589. This is 3.5% higher than last year.
  10. Cash sales were 16.5% of all sales last month.

Some of my favorite images this month:

days on market in placer county by sacramento appraisal blog months of housing inventory in placer county by sacramento appraisal blog 2 Placer County price and inventory - by sacramento appraisal blog Placer County sales volume - by sacramento appraisal blog

interest rates inventory median price in placer county by sacramento appraisal blog

DOWNLOAD 70 graphs HERE: Please download all graphs in this post (and more) here as a zip file (including a one-page quick stat sheet). See my sharing policy for 5 ways to share (please don’t copy verbatim). Thanks.

Questions: Did I miss anything? What are you seeing out there? How would you describe the market? I’d love to hear your take.

If you liked this post, subscribe by email (or RSS). Thanks for being here.

Share:

  • Click to share on Twitter (Opens in new window)
  • Click to share on Facebook (Opens in new window)
  • Click to share on LinkedIn (Opens in new window)

Filed Under: Market Trends Tagged With: 2017 real estate, February 2017, graphs of real estate, Home Appraiser, House Appraiser, housing market update in Sacramento, increasing values, low inventory, Placer County Real Estate Market, real estate trends, Sacramento County Real Estate, sacramento regional housing market, sales volume, spring housing market

Sagging stats and increasing values (and a market update)

February 16, 2017 By Ryan Lundquist 9 Comments

January stats are down, but the market feels up. That’s normal at this time of year, but it can be confusing. Let’s focus on three things to keep in mind about the beginning of the year in real estate, and then let’s unpack the market. This post is long on purpose. You can scan it quickly or pour a cup of coffee and spend some time here. If you aren’t in Sacramento, I hope you can still find some value. Do you see any parallels to your market? Any thoughts? 

39613867 - close up of weathered and textured boards on an old wooden farm door

3 things to keep in mind about the beginning of the year in real estate

1) Recent sales lag the real trend: At this time of year it’s important to remember that the most recent sales don’t necessarily tell us about the current market. It’s like a pregnancy test. You might be pregnant, but an over-the-counter test won’t tell you that for two weeks even though there has been a change in your body. Similarly, the market may have changed, but we may not see the price change in the stats for a month or two.

2) Insane appreciation: We are seeing multiple offers, but in many cases it seems the market is trying to get back to prices from the peak of summer rather than showing rapid value increases like we saw in 2013. I recently heard about a property getting into contract 5% above sales from December, but that doesn’t mean the market actually increased in value by 5% over the past month. It could simply be the market is pulling itself out of the fall seasonal lull and getting back to prices from the summer (where they were 5% higher).

3) We see the market in the pendings: If we want to see the current market we have to look at the pendings and listings. Let’s obviously give strong weight to properties that have actually sold, but we cannot ignore pendings to help us gauge the direction of prices for the current market. If we rely too heavily on sales from December and January alone, we might essentially undervalue properties because the market usually ticks up during the early part of the year (which we would see in the pendings). In other words, today’s higher pendings will close over the next 30-60 days and then show value increases on paper for March and April. But the truth is the value increases are actually happening right now. It just takes skill to be able to see the market before the change shows up in the stats. This is why have to give way more respect to pendings. I realize we don’t know the exact price of pending sales though, and that’s why we have to look at many examples of pendings rather than just one. In some markets pendings get into contract at ridiculous levels too, so we have to sift if the prices are realistic (that makes it even more tricky). If there are few listings in a neighborhood, we can look at competitive neighborhoods for more data because we don’t want to base the entire market on just one listing or pending. Let’s not forget to be in tune with where sales left off at the end of summer too.

Appraisal class: I’m teaching a 3-hour class next week on Feb 22 at SAR called How to Think Like an Appraiser. I’d love to have you come. Details here.

DOWNLOAD 77 graphs HERE: Please download all graphs in this post (and more) here as a zip file (including a one-page quick stat sheet). See my sharing policy for 5 ways to share (please don’t copy verbatim). Thanks.

A Market Summary: The market is always interesting in the early part of the year because we are in a place where values have changed, but we don’t see the change in the sales stats yet. So there is a disconnect between reporting slow January data and how the market feels right now. What I mean is the median price softened last month by 3%, sales volume declined by 27% from December, and it took 3 days longer to sell a house than the previous month. If we didn’t know any better we’d say the market was tanking. But let’s back up and think through this.

January sales stats aren’t often very sexy because they represent properties that went into contract in November and December. Do you remember Thanksgiving and Christmas? Yeah, you probably weren’t looking for a house, so it’s not a surprise to see sales stats sag from those months. At times the real estate community doesn’t like to admit the market shows a price lull during the fall, but a lull happens nearly every single year. So if we’re not careful we can focus on sales volume declining last month by 27% without realizing that’s normal to see every January (see graphs below). The irony is it’s easy to say we are in trouble because sales volume declined, but this January actually had its strongest month of volume in 4 years. We might also be concerned about sales showing a good 5% or so decline from the height of summer, but that’s not unusual (see graphs). Or we can freak out about sales taking longer to sell, but over the next month or two we are bound to see this stat change as it will begin to take less time to sell during the spring.

The truth is the market is beginning to heat up. Right now we have an atmosphere of multiple offers in many price ranges. Let’s remember though the market feels more aggressive than actual value increases at times. Moreover, it’s easy to let news of a “hot” real estate market or anemic housing inventory trump actual market data. Thus I would caution sellers to price according to the market instead of the headlines. Just because inventory is spare does not mean you can get whatever price you want too. I would also remind buyers that the bulk of listings don’t usually come on the market for a few months (April through August tends to be the peak).

Sacramento County:

  1. The median price softened to $305,000 (down 7% from summer).
  2. The median price is currently 8.9% above January 2016.
  3. Sales volume was stronger in January than it’s been in 4 years. We could focus on sales volume declining by 27% from December, but volume always declines from December. See the graphs below.
  4. Sales volume in January 2017 was 14% higher than last year.
  5. One year ago in January it was taking 4 days longer to sell.
  6. FHA sales volume is down 6% this year compared to 2016 (but 27% of all sales were FHA last month).
  7. Only 3% of all sales were bank-owned last month and 2.4% were short sales.
  8. The average price per sq ft was about $202 last month (about the same as December, but 8% higher than last year).
  9. The average sales price softened 1% last month and is currently $339,028. This is down 5% from the height of summer (but is 9% higher than last year).
  10. Cash sales were 15% of all sales last month.

Some of my favorite images this month:

Median price since 2013 in sacramento county

january and december

january seasonal market in sacramento

inventory in sacramento county Since 2013 - part 2 - by sacramento appraisal blog

price metrics since 2015 in sacramento county - look at all

CDOM in Sacramento County - by Sacramento Regional Appraisal Blog

inventory - January 2017 - by home appraiser blog

SACRAMENTO REGIONAL MARKET:

  1. The median price softened to $339,000 (down 8% from summer).
  2. The median price is currently 5% above January 2016.
  3. Sales volume in the region is up about 2% over the past year.
  4. Sales volume in January 2017 was 7.6% higher than last year.
  5. One year ago in January it was taking 3 days longer to sell.
  6. It took an average of 47 days to sell a home last month.
  7. FHA sales volume is down almost 7% over the past year (but still 23% of all sales were FHA last month).
  8. The average price per sq ft was about $208 last month. This is down about 1.5% from summer, but 5.7% higher than last year.
  9. The average sales price softened 2% last month and is currently $380,151. This is down about 6.5% from summer (but is 5.9% higher than last year).
  10. Cash sales were 16% of all sales last month.

Some of my favorite images this month:

median price sacramento placer yolo el dorado county

Regional Inventory - by Sacramento regional appraisal blog

days on market in placer sac el dorado yolo county by sacramento appraisal blog

inventory in sacramento regional market

sacramento region volume - FHA and conventional - by appraiser blog

PLACER COUNTY:

  1. The median price is $424,500 (down 3% from the height of summer).
  2. The median price is currently 4.8% above January 2016.
  3. Sales volume in Placer County was down almost 13% this January compared to last January. 
  4. Sales volume in January was nearly identical in volume to January 2014 and January 2015.
  5. Housing supply is down 4% from last year.
  6. It took an avg of 52 days to sell a home last month (same as Jan 2016).
  7. The average price per sq ft was about $211 last month. This is down about 2.5% from summer, but about 5% higher than last year.
  8. The average sales price softened 1% last month and is currently $467,276. This is down about 3% from summer (but is 3% higher than last year).
  9. Bank-owned sales were 2.4% of all sales last month (short sales were 1.3%).
  10. Cash sales were 19.5% of all sales last month.

Some of my favorite images this month:

Placer County price and inventory - by sacramento appraisal blog

Placer County sales volume - by sacramento appraisal blog

months of housing inventory in placer county by sacramento appraisal blog 2

days on market in placer county by sacramento appraisal blog

Placer County housing inventory - by home appraiser blog

DOWNLOAD 77 graphs HERE: Please download all graphs in this post (and more) here as a zip file (including a one-page quick stat sheet). See my sharing policy for 5 ways to share (please don’t copy verbatim). Thanks.

Questions: Did I miss anything? What are you seeing out there? How would you describe the market? I’d love to hear your take.

If you liked this post, subscribe by email (or RSS). Thanks for being here.

Share:

  • Click to share on Twitter (Opens in new window)
  • Click to share on Facebook (Opens in new window)
  • Click to share on LinkedIn (Opens in new window)

Filed Under: Market Trends Tagged With: 2017 real estate, graphs of real estate, Home Appraiser, House Appraiser, housing market update in Sacramento, increasing values, January 2017, low inventory, Placer County Real Estate Market, real estate trends, Sacramento County Real Estate, sacramento regional housing market, sales volume

  • Go to page 1
  • Go to page 2
  • Go to page 3
  • Interim pages omitted …
  • Go to page 6
  • Go to Next Page »

Primary Sidebar

Connect with Ryan

 Facebook Twitter LinkedIn YouTube Instagram

Subscribe to Weekly Post

* indicates required

Search this site

Blog Categories

  • Appraisal Stuff (406)
  • Bankruptcy (3)
  • Divorce (4)
  • Estate Settlement (6)
  • FHA Appraisal Articles (56)
  • Internet (53)
  • Market Trends (476)
  • Photos from the Field (126)
  • Property Taxes (70)
  • Random Stuff (230)
  • Resources (566)
  • Videos (161)

Blog Archives: 2009 – 2019

Lundquist Appraisal Links

  • Appraisal Order Form
  • Appraisal Website
  • Rancho Cordova Appraiser Website
  • Sacramento Appraisal Blog Sitemap
  • Sacramento Real Estate Appraiser Facebook Page
  • Twitter: Sacramento Appraiser (@SacAppraiser)
  • YouTube: Sacramento Appraiser Channel

Most Recent Posts

  • The housing market nobody predicted
  • Real estate trends to watch in 2021
  • You carried me & a spreadsheet for Christmas
  • Real estate drama (and a market update)
  • Goodbye California. Is everyone leaving?
  • How much are buyers paying above the list price?
  • What would happen to the housing market if we went on lockdown again?
  • Overpricing, multiple offers, & hot ranges
  • Why your home isn’t worth 16% more today
  • Condos, halfpipes, & cooling 2-4 units

Disclaimer

First off, thank you for being here. Now let's get into the fine print. The material and information contained on this website is the copyrighted property of Ryan Lundquist and Lundquist Appraisal Company. Content on this website may not be reproduced or republished without prior written permission from Ryan Lundquist.

Please see my Sharing Policy on the navigation bar if you are interested in sharing portions of any content on this blog.

The information on this website is meant entirely for educational purposes and is not intended in any way to support an opinion of value for your appraisal needs or any sort of value conclusion for a loan, litigation, tax appeal or any other potential real estate or non-real estate purpose. The material found on this website is meant for casual reading only and is not intended for use in a court of law or any other legal use. Ryan will not appear in court in any capacity based on any information posted here. For more detailed market analysis to be used for an appraisal report or any appraisal-related purpose or valuation consulting, please contact Ryan at 916-595-3735 for more information.

There are no affiliate links on this blog, but there are three advertisements. Please do your homework before doing business with any advertisers as advertisements are not affiliated with this blog in any way. Two ads are located on the sidebar and one is at the bottom of each post. The ads earn a minor amount of revenue and are a simple reward for providing consistent original content to readers. If you think the ads interfere with your blog experience or the integrity of the blog somehow, let me know. I'm always open to feedback. Thank you again for being here.

Copyright © 2021 Sacramento Appraisal Blog