If you torture the stats long enough, they’ll confess to anything. Have you heard that before? Well, it’s true in real estate. If we’re not careful, we can make numbers say anything, whether for a glowing or doom narrative. Today, I want to talk about the danger of annual stats right now, and then I have a massive market update to share. This post is designed to skim by topic or digest slowly. I hope you get some value here, whether you’re local or not.

UPCOMING (PUBLIC) SPEAKING GIGS:
1/12/23 McKissock / Appraisal Buzz Webinar (register here)
1/18/23 WCR Market Update in Cameron Park (register here)
1/19/23 Big market update at SAR on Zoom (register here)
1/20/23 NARPM Luncheon
1/23/23 Residential RoundUP on Zoom (register here (free))
1/27/23 Q&A Appraiser Marketing (free Zoom webinar) (sign up here)
2/8/23 SAFE Credit Union “Snacks & Facts” (for RE) (register here)
3/10/23 PCAR Market Update Lunch & Learn (detailed TBD)
3/28/23 Downtown Regional MLS meeting
4/1/23 NAA Conference in Sacramento
IT’S EASY TO ABUSE ANNUAL NUMBERS RIGHT NOW
Last year had two parts. It was super-hot at first, and then it got really dull, and this makes for a weird combination when putting these parts together.
A) HIDING THE TREND WITH ANNUAL STATS
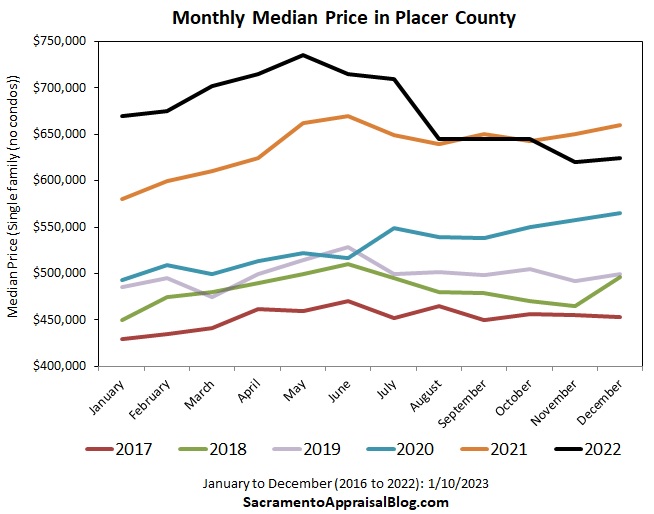
Check out this visual. When comparing all sales from 2021 with 2022, the median price technically went up 7%. This is statistically true because there was so much growth during the first part of the year, BUT focusing on annual stats hides the huge shift in recent months.

CLARIFYING ANNUAL STATS: Annual means we’re comparing ALL of 2021 with ALL of 2022. So this is where we’re comparing the median price of 28,000 sales in 2021 with 22,000 in 2022. So we are literally looking at the entire year and comparing it to another year. It’s actually a cool way to see the market and gauge appreciation over time. In a normal year, I would be a fan of sharing annual appreciation rates, but this year I think it hides the real trend happening in the market. So if I were to only focus on the annual difference this year and say, “The median went up 7%,” it’s just not telling the full story of what is happening. I think looking at year-over-year stats (December 2021 vs December 2022) and month-to-month stats (May to December) really helps us see the market trend. I think it’s fine to share annual stats, but it can quickly become misleading or stink of greasy salesperson vibes.
If annual vs current stats were a meme…

B) FALSE NARRATIVES FROM ANNUAL STATS
The danger of focusing on annual stats right now is annual numbers look far sexier than the current market, so it’s easy to hide the real trend by looking to older figures. It would be like looking at the average price of bitcoin over the past two years instead of the price right now.
ANNUAL VS. THE REAL TREND:
Annual volume was down about 20%.
Volume lately has been down over 40%.
It took an average of 25 days to sell last year.
Last month it took an average of 49 days to sell.
The median price rose 7% annually last year.
The median price declined 15% since May.

C) GAINING & LOSING CREDIBILITY WITH ANNUAL STATS
Some real estate professionals are going to gain credibility this year and others will lose it. My advice? Be transparent with the stats and DO NOT create a narrative that obscures the real trend. Likewise, don’t impose a doom narrative on the market either. I wrote more about this last week. Look, we all have ideas about the future, but let’s be real about the market that actually exists.
Thanks for being here.
—–——– DEEP LOCAL MARKET UPDATE ———––
 We are in a market of change, and change continued last month.
Scroll quickly or digest slowly.
SHARING POLICY: I welcome you to share some of these images on your social channels or in a newsletter. In case it helps, here are 6 ways to share my content (not copy verbatim). Thanks.
VOLUME WILL IMPROVE AS AFFORDABILITY GETS BETTER:
We are in a valley right now where we’re missing about 40% of the market. There is no sugarcoating this. The reality is lots of prospective buyers are on the sidelines due to the struggle to afford current prices. With that said, more than half of buyers are present and shopping, so the market is still moving.
This week I talked with someone who is actively hunting for homes with an agent, but he is still hesitant. He said it’s nice to maybe get tens of thousands off the list price, but he is still concerned about the lofty monthly mortgage payment. Look, sharp price declines have been helpful for affordability, but rates above 6% are still making it tough to make things work. Anyway, the market will figure this out, and more buyers will come back as affordability improves. That’s the truth.
DECEMBER VOLUME WAS NOT PRETTY:
December had the lowest volume in Sacramento County over the past 20 years, and the region is basically tied with 2007. There are two stats here. There are over 800 missing sales from the pre-pandemic normal, but there were nearly 1,300 sales that happened. I recommend for real estate friends to know all the numbers, but in terms of business, focus on the part of the market that is happening rather than the part that isn’t.


NOTE: Placer County has experienced massive growth this past decade, so a comparison to the previous decade looks different than Sacramento County. Still, it was a really dull month of closed sales.


PRICE STATS ARE DOWN ABOUT 4-5% FROM ONE YEAR AGO:
Here’s a look at stats compared to last year. Remember, closed sales in December really tell us what the market used to be like in November when the bulk of these properties got into contract. In a normal year we tend to see price metrics dip from December to January, so let’s see what happens ahead.


PRICE STATS ARE DOWN CLOSER TO 15% FROM MAY:
We’ve seen significant change since May, but the market still doesn’t feel affordable to lots of people. I’m not trying to be negative. This is just how it is, and we’ll see more buyers come back to the market as affordability improves. Keep in mind median price change doesn’t necessarily mean value is actually down by that amount. This is why I advise looking to neighborhood comps rather than imposing a county or ZIP code price metric on a neighborhood.


PRICES WENT DOWN FROM NOVEMBER TO DECEMBER:
Looking at sequential months is key so we don’t just get stuck or hyper-focused on last year (the past). Like I said above, it’s easy to hide behind older stats if we’re not careful.


OTHER PRICE VISUALS:
These visuals help show that prices are a bit lower than last year, but check out the sharp change in order to get here.


TAKING ABOUT A WEEK LONGER TO SELL:
It took about a week longer to sell last month in Sacramento County compared to the pre-pandemic normal (red line). I’ll push out other county visuals soon too (especially during my presentations coming up). However, this is over twice the time it took last year, so it feels dramatic to see 45 days lately. Historically this isn’t all that high, but it’s been a real adjustment to get used to a market where not everything is selling in the first weekend. However, keep in mind these figures only represent properties that closed escrow, and there are lots of listings that didn’t close (key point).

NEW LISTINGS ARE COMING:
We’re seeing more listings hit the market, but it’s very normal for new listings to not hit their stride until March or so. Buyers are waking up for the year though and they’re hungry for quality listings after a stale fall season of overpriced leftovers. And yes, serious buyers are shopping – even in the rain. I’ll push out some inventory images soon, but on paper things are pretty normal in terms of the months of housing supply. We technically really don’t have many listings on the market, but like I keep saying, it doesn’t matter about technicalities right now. The market has been declining despite low supply since affordability is the bigger issue. Now let’s see what 2023 brings. As I said last week, we can expect more attention on the market during the spring.

ANNUAL RECAP:
Okay, here are some annual recap images organized by county. These visuals include every single sale for the entire year, so it’s a weird combination of a blazing hot market and a dull market. I deliberately didn’t include price stats on most recap visuals because I honestly think it would lead to confusion (and some might even think it was misleading).
2021 comparison: 2021 did have slightly higher volume, so the ideal is to compare the pre-pandemic average to 2022, and I’ll roll out some stats soon to show you what I mean. But it’s still a legit comparison to compare the past two years. For instance, volume was down 22% from last year, but it was down 19% from the pre-pandemic average. Yes, there is a clear difference, but we’re not talking about twice as many sales last year. Granted, new construction numbers were truly sensational in 2021, so it’s honestly a mistake to only focus on 2021 vs 2022 numbers for that niche. More on that eventually.
SACRAMENTO REGION:


SACRAMENTO COUNTY:


PLACER COUNTY:


EL DORADO COUNTY:


YOLO COUNTY:


MARKET STATS: I’ll have lots of market stats out this week on my social channels, so watch Twitter, Instagram, LinkedIn, and Facebook.
Thanks for being here.
SHARING POLICY: I welcome you to share some of these images on your social channels or in a newsletter. In case it helps, here are 6 ways to share my content (not copy verbatim). Thanks.
Questions: What stands out to you above? What are you seeing happen in the market right now? I’d love to hear your take.
If you liked this post, subscribe by email (or RSS). Thanks for being here.


