Do you feel it? The temperature of the housing market has started to change. Let’s talk about what’s going on, and what this means and doesn’t mean. I’d love to hear your take in the comments.

Think Like an Appraiser Class: I’m teaching my favorite class on April 28 from 9am-12pm. We’ll talk through choosing comps, making adjustments, and lots of practical scenarios. Hope to see you there.
DON’T CALL IT A DULL MARKET:
The housing market is still lopsided. We are far from normal, but we are likely starting to feel some of the effect of 5% mortgage rates. In short, the real estate market is ultra-competitive, but the temperature has begun to cool from ultra white hot to white hot. Or like my friend Jonathan Miller said when describing Manhattan, “Not as frenzied, but still blistering.” If you have a better word picture, speak on.
WHAT THIS MARKET LOOKS LIKE:
A few days ago, on my Facebook page, I mentioned there was a temperature change, and Realtor Tony Yuke shared the following. I think this helps describe how the current market feels. Still very competitive, but not as competitive as 30 days ago.

WHAT THIS DOESN’T MEAN:
I’ve heard some people talk about the housing market starting to correct, but there isn’t any statistical support for that right now. What we know is the market is starting to show a temperature change, and we’ll see that change in sales stats down the road. Frankly, a cooling should be happening somewhere around April anyway, so we need some time to understand if this is a normal seasonal thing or something else. For now, we are far elevated beyond a normal market, and demand is still outweighing supply. My advice? Be objective, pay attention to stats, avoid sensationalism, and change your narrative based on the numbers.
One more thing. It would be healthy to see price deceleration ahead. We need this wild stallion of a market to stop growing so rapidly.
THE WORD ON THE STREET:
The stories of today become the stats of tomorrow. A couple of weeks ago I asked Instagram if they’ve been seeing fewer offers, and the results were definitive. I know, this isn’t a scientific poll, but the word on the street matters in real estate. And this lines up with what I’ve been hearing on my social feeds from boots-on-the-ground people. However, I also had a number of agents tell me it’s a bloodbath at entry-level price points still.

ACTUAL STATS:
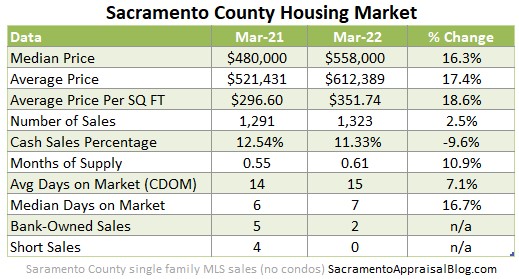
Sales stats from March are insane, but glowing sales stats really tell us what the market used to be like in February when these properties got into contract. This is why it’s key to watch other metrics beyond just sales. Here are a few things on my radar (without writing a dissertation).
Mortgage applications have dipped:
Across the country we’ve started to see fewer mortgage purchase applications. This is something to watch. Will fewer mortgage applications lead to fewer pending contracts? And then fewer sales?

Price reductions are starting to increase (barely):
We’re starting to see price reductions inch up according to Altos Research. However, the number of reductions is WAY lower than a normal year (but slightly higher than last year). Keep in mind around April we should start to see an increase in price reductions as a part of a normal seasonal trend.
Mortgage payments are skyrocketing:
Added later on 4-14-22. I wanted to post this image from Tim Ellis of Redfin. This is what is happening in the background. Mortgage payments are skyrocketing. Keep in mind this doesn’t affect everyone the same way though. I suspect this will disproportionately impact buyers at lower prices. This type of massive change in a short period of time means it’s important to do a housing market play-by-play each week to gauge any difference in buyer demand.

More listings are hitting the market (not enough):
The number of listings has been increasing. Yet, we still only have about three weeks of supply in the Sacramento region, which is ridiculously low. On one hand, an increase of listings can help tame the temperature a bit, but be careful about getting sensational. So far, the level of new listings looks very seasonal, and it’s not at an elevated level beyond the appetite of buyers. By the way, we’ve now had twenty-one months in a row with less than one month of supply.

Paying above the list price has started to “soften”:
We’re starting to see buyers get into contract at slightly lower levels. The irony is the “lower” numbers are completely elevated. What I mean is during a normal year, buyers should be paying 1-2% BELOW the list price around this time. But buyers have been paying more than 3% ABOVE the list price on average. So we might see a subtle sign of “softening,” but we need to take this “slower” trend with a grain of salt. If anything, this reminds us the market is still quite lopsided.
When looking at these visuals, do you see what looks like a spring peak a couple of weeks ago? Technically, we need a few more weeks to understand if this was a peak or not. Keep in mind it’s not uncommon to see demand crest around April. This is in part why I think it’s premature to call this temperature change a price cycle peak. We need time to see the trend.


More analysis soon. In the meantime…

I hope that was helpful. What else are you watching?
Thanks for being here.
—–——– BIG MARKET UPDATE FOR THOSE INTERESTED ———––
 Skim or digest slowly.
QUICK SUMMARY:
The market has seen explosive price growth during the first quarter in the Sacramento region. Frankly, the growth has started to feel unhealthy because it’s just been too quick. But this is what happens when supply is next to nothing AND buyers rush the market to lock in a low rate.
As I mentioned, the temperature has begun to change though. I suspect I’ll get some hate mail from a few people accusing me of saying the market is slow (I didn’t say that). The truth is the temperature in real estate is constantly changing, so it’s important to recognize that. If you cannot embrace that, ask yourself why.
In short, March stats are unreal. Two words. Freaking bananas.
A quick recap:

Some visuals eh…
SHARING POLICY: I welcome you to share some of these images on your social channels or in a newsletter. In case it helps, here are 6 ways to share my content (not copy verbatim). Thanks.
SOLID SALES VOLUME IN 2022:
So far sales volume has been strong in the region in 2022. The black line represents monthly sales this year compared to last year (red line). The key will be watching what happens with volume over time. If buyers start to pull back, it’s possible we’ll see lower volume. That’s what some bigger data firms are predicting, and it seems plausible.

SELLING QUICKLY:
Properties have been selling very quickly. Technically it took one extra day to sell this March in Sacramento County, but look how fast properties have been selling compared to normal. Moreover, current pending contracts in the region over the past two weeks have spent two days fewer on the market compared to March sales. This reminds us the market is moving quickly and there is still heavy competition out there.

MASSIVE PRICE GROWTH:
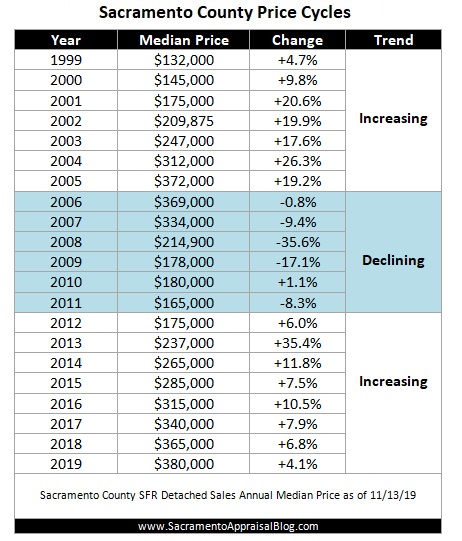
We’ve seen massive price growth in the region in 2022. It’s normal to see prices rise through March and beyond, but this has been really hefty growth – especially in the eleventh year of this price cycle.

BUYERS ARE PAYING WAY ABOVE NORMAL:
On average buyers paid nearly $23,000 over the asking price last month. This is far above a normal March where buyers tend to pay closer to $10,000 BELOW the list price. It’s important to note March 2022 was about twice as much as March 2021 (which was previously our most aggressive market ever). Keep in mind this is the average of every single escrow. This number doesn’t perfectly describe every individual transaction. In other words, some buyers went way above this number and some went lower. The takeaway here is to know how disconnected this number is from normal. Also, when people talk about the market temperature changing, ask yourself how disconnected we are from normal still.


BUYERS MADE MORE AGGRESSIVE OFFERS:
These numbers are freakish. It’s wild to see only 6.47% of homes sell below the list price. We should be seeing easily about twice as many homes selling at or below the list price. Again, this tells us the market is still imbalanced. But in the background, sellers ought to pay attention to any temperature changes. My advice? Price reasonably and see what the market gives you.

YEAR OVER YEAR:
Year over year stats are important to digest, but don’t forget to look at month to month stats to understand what the market is doing right now. Also, not every location and price range have the same trend.


MONTH TO MONTH:
Looking at sequential months is key too so we don’t just get stuck or hyper-focused on last year (the past).


OTHER VISUALS:
As if anyone really wanted more…


MARKET STATS: I’ll have lots of market stats out this week on my social channels, so watch Twitter, Instagram, LinkedIn, and Facebook.
Thanks for being here.
SHARING POLICY: I welcome you to share some of these images on your social channels or in a newsletter. In case it helps, here are 6 ways to share my content (not copy verbatim). Thanks.
Questions: What are you seeing out there in the market?
If you liked this post, subscribe by email (or RSS). Thanks for being here.


 THE SHORT VERSION:


