A quick change in rates has led to a quick change in the housing market. We didn’t see much difference right away in the stats, but we are finally getting some good numbers now. Let me show you what I mean.

UPCOMING (PUBLIC) SPEAKING GIGS:
7/15/2022 Lunch & Learn Market Update (sign up (for real estate agents))
7/20/2022 Beer & Stats at Out of Bounds (sign up (for real estate agents))
7/26/2022 Navigating the Shift (sign up here (for real estate community))
BEER NEWS:
I just finished two years without alcohol. I gave up alcohol for health reasons, and it’s been a good experience. I’ll be adding another year now, so if anyone wants to join, let me know.
FIVE THINGS TO WATCH IN TODAY’S MARKET:
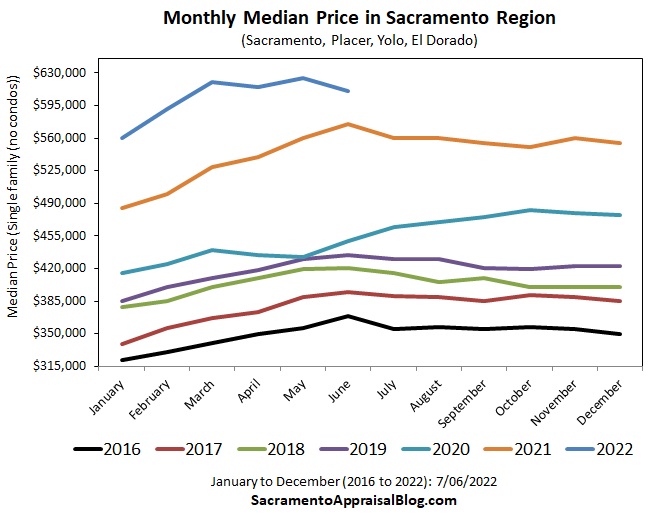
We’ve seen quick change in the stats lately. Check out how steep the line is between May and June in some of the visuals below. This is what I mean by “sharp” change. Let’s keep watching while staying objective.
1) PRICE GROWTH IS SLOWING
Price stats aren’t as sexy as they used to be. This visual doesn’t necessarily look sensational, but instead of being up 15-20% from last year, prices in most counties are now “only” up about 6-7% instead. In short, we are seeing price growth slow down. Right now, the growth actually looks somewhat normal at 6-7%, but let’s keep watching this line to get a sense of the direction of prices. In a normal year we should see prices soften for the next few months and then flatten out for the rest of the year.


2) BUYERS ARE FINALLY PAYING BELOW THE LIST PRICE
For seventeen months in a row buyers paid at or above the list price on average. This is profoundly atypical, but it’s been our normal for so long that I think we’ve gotten used to it. This visual shows buyers in June 2022 on average paid about one percent below the original list price (or $7,254 less on average). Look at how sharp the change was from the previous month. For now, the stat is actually very normal compared to 2018 and 2019, but let’s keep watching to see where the line goes in months ahead.


3) FEWER PENDING CONTRACTS ARE HAPPENING
One of the bigger ways we are seeing a shift in the market is with the number of pending contracts dipping for three months in a row. In most local counties in June, we were down a whopping 25% in volume from last year at the same time. On the positive side, this means 75% of pendings are still happening, but there is no ignoring the reality that we had over 1,600 fewer pending contracts over the past few months compared to last year. The black line below represents 2022, and this June was the lowest year in recent time. This isn’t a big surprise because mortgage rates doubling in a short period of time has given affordability a beatdown. This means fewer buyers are able or willing to play the game right now.

4) A SHARP INCREASE IN LISTINGS

5) LOTS OF PROPERTIES STILL SELL ABOVE THE LIST PRICE:
It’s easy to say everything is selling below the list price, but that’s fiction. In truth, almost 53% of sales last month sold above the list price, so it’s safe to say about half the market went above the original list price. Of course, this is a sharp change from last year when 76% of sales sold above the list price, so we’ve clearly moved beyond that honeymoon market. And I know, it would be helpful to have more years on this visual, but I don’t have that (yet).

6) OTHER VISUALS:
Okay, here are some other visuals in case that’s your thing. The stats are finally showing some bigger changes. I remember someone arguing with me in April that the market hadn’t shown much of a temperature change. The truth is the market did change, but we didn’t see change in the stats…. yet.


OKAY, ONE MORE:
May to June median price change: This last visual shows median price change from May to June from 2004 onward. This is a bit geeky, but it’s atypical to see the median price dip between May and June. I mean, it happens, but typically this takes place when the market is declining or in a year where there was dullness in the marketplace. For this year, keep in mind the 2022 real estate season crested early, so we are now comparing subdued stats today to heightened stats last year. I’m not sugarcoating at all here. It’s just key to know what we are comparing and how that makes a difference with the numbers.
On a related noted, for many in real estate prices are sacred, but I don’t take that view. Markets go up and down. That’s just what happens. Thus, my role here is to tell the story of the market without any bias. I’m not here to protect prices or promote doom. I want to sling the straight dope and help convey what is happening.
Anyway, I hope my explanation for May to June change makes sense. I’m happy to talk about that more in the comments. We need a few more months to understand price trends more definitively.

MARKET STATS: I’ll have lots of market stats out this week on my social channels, so watch Twitter, Instagram, LinkedIn, and Facebook.
Thanks for being here.
Questions: What stands out to you the most above? What did I miss? Anything else to add?
If you liked this post, subscribe by email (or RSS). Thanks for being here.