• Skip to primary navigation
  • Skip to main content
  • Skip to primary sidebar

Sacramento Appraisal Blog | Real Estate Appraiser

Real estate appraisals for divorce, estate settlement, loans, property tax appeal, pre-listing and more. We cover Sacramento, Placer and Yolo County. We're professional, courteous and timely.

  • About
  • Appraisals
  • Order
  • Ask Ryan
  • Areas
  • Classes
  • Press
  • Trends
  • Share
  • Contact

prices

Seven things to watch in real estate during a pandemic

April 14, 2020 By Ryan Lundquist 25 Comments

What’s the market doing? What can we watch right now to get a better sense of housing trends during the pandemic? Here are seven things I’m keeping my eyeballs on these days. Anything to add?

SEVEN THINGS I’M WATCHING DURING THE PANDEMIC

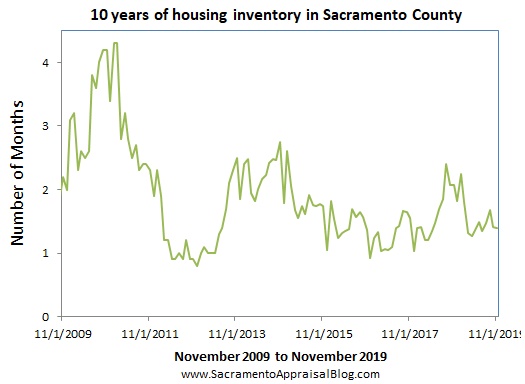
1) Listings: We often think about listings increasing as a way to see the market changing, but right now many markets across the country are seeing fewer new listings. So at times change is best seen with less of something rather than more. It’s not a surprise to see fewer new properties during a pandemic, right?

2) Pendings: When the number of pending contracts declines it’s likely a sign that buyers have begun to back off the market. Like many areas across the country, pendings are down 40% right now in the Sacramento region. There are simply fewer buyers willing to engage with the current market. Also, one of the things we want to watch is the gap between all listings and current pendings. If this gap widens it will soften prices and give buyers more power.

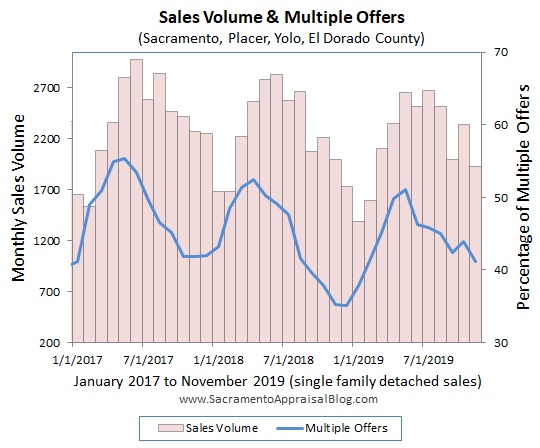
3) Sales volume: When fewer sales start to happen, it’s a sign the market has changed for some reason. This image below shows we are at the beginning stages of seeing sales volume dip due to the pandemic. In other words, the second week of April clearly saw FAR fewer sales compared to last year at the same time. From here on out it’s likely we’re going to see bigger changes in sales volume since many homes beginning to close got into contract over the past month during the pandemic.

4) Canceled / Hold: A market isn’t just about what is listed, but what used to be listed. There have been over 1,000 listings taken off the market in the Sacramento region over the past four weeks. The removal of these listings has helped the market feel much more balanced than had these listings still been active. Key questions: How many of these listings will come back? When will they hit the market? Will there be enough pent-up demand to meet the supply?

5) Word on the street: What are buyers, sellers, and real estate professionals saying? The stories of today become the stats of tomorrow, so paying attention to what people are saying is huge.

6) Other metrics: There isn’t one end-all metric to tell us everything we need to know about the market, so it’s important to pay attention to lots of little things such as days on market, changes in financing, the average list price, the sales to original list price ratio, price reductions, the number of multiple offers, changes in various price ranges, concessions offered by sellers, etc… Let’s remember the market isn’t going to be the same for every property type or in every price range or neighborhood.

7) Prices: In real estate we are so obsessed with prices, but that’s really the last place to look to see the market. What I mean is change happens first in the areas above before showing up in sales stats a couple months down the road. In short, for now the slower pandemic trend hasn’t infiltrated sales price figures as of yet in Sacramento. This doesn’t mean the market is stable in every price range and location. All I’m saying is regional and county stats don’t show price declines right now. Normally I pull monthly price data, but I’ve switched to weekly in order to see the trend sooner rather than later.

I hope that was helpful. And yeah, that was long. But hopefully it was worth digesting whether you’re local or not.

Okay, moving on.
 

A FEW RESOURCES:

New market video: Here is a fresh market update video. This is 30 minutes and perfect for the background while quarantining. Check it out below or here.

Q&A video: Here is a video I did recently with Doug Reynolds to talk about the market and appraisal stuff. I have many of these lined up and I’m glad to share them in the future. As a side note, I’m not an advocate for any brokerage and I’ll never take sides. I’ll do interviews with just about anyone as long as there is mutual respect and I have time to do so. I’ll share videos here only if the end-product is worth sharing.

Zoom with Grounded: I mentioned a Zoom meeting last week hosted by Grounded and some of you were able to join live (thank you). I have about four to five Zoom sessions per week these days, though most aren’t public. I look forward to doing these with many brokerages. Watch below or here.

BIG MARKET UPDATE (ON HOLD): I normally write a huge market update around this time of the month, but my entire life and social media feed has been one big market update lately. So I’m putting my typical format on pause so I can spend time on more pressing visuals.

I hope this was interesting or helpful. Thanks for being here.

Questions: What are you watching in today’s market? Did I miss anything?

If you liked this post, subscribe by email (or RSS). Thanks for being here.

Share:

  • Click to share on Twitter (Opens in new window)
  • Click to share on Facebook (Opens in new window)
  • Click to share on LinkedIn (Opens in new window)

Filed Under: Market Trends Tagged With: coronavirus and real estate, COVID-19, Doug Reynolds, Grounded, listings, pandemic real estate market, prices, real estate metrics, Ryan Lundquist, Sacramento Appraisal Blog, Sacramento Real Estate, sales volume, what to watch during a pandemic

‘Tis the season for real estate predictions

December 12, 2019 By Ryan Lundquist 17 Comments

Buckle up. It’s real estate prophet season where everyone and their Mom has a prediction about the market next year. Here are some quick thoughts and then a deep dive into local trends for anyone interested.

1) Nothing too extreme: So far I’m not hearing too many extreme views on the housing market. What I mean is there aren’t as many voices saying, “It’s going to tank” or “We’re going to have massive increases.” For instance, here’s a forecast from Realtor.com and it’s pretty mild. Very little price growth and a dip in the number of sales too. For reference, I wouldn’t base my perception of the market on any forecast.

2) Consumer thoughts & Twitter: I asked Twitter to predict and people seemed to mostly think prices would be flat or modest. This isn’t anything scientific, but the results don’t surprise me based on conversations I’ve been having. If you work in real estate, ask people what they think. But be careful about opinions formed from headlines instead of local data.

3) Beware of the prophets: Spoiler alert. Nobody knows what the market is going to do, so beware of false real estate prophets who predict the same thing every year and then repackage their predictions for the new year. My advice? Don’t lose credibility by trying to predict the future. It’s okay to say, “My crystal ball is broken, but I can tell you what the market is doing right now.” This doesn’t mean we don’t have ideas where things might go based on current data, but it does mean we’re ultimately humble about our ability to predict the future.

And now ironically here’s a piece from the Sacramento Bee on where the market is heading in 2020 (behind a paywall). I was asked to pitch in some thoughts and I did. Of course like a broken record I always start a media interview like this with, “My crystal ball is broken…. Here are some things to consider.”

Any thoughts?

—–——– Big local market update (long on purpose) —–——–

This post is designed to skim or digest slowly.

Summary: Some fall seasons are really dull, but this hasn’t been one of them. In fact, if you’re looking for a slogan right now it could be, “Hey man, it’s not that dull.” The numbers look pretty hot too, but there’s a reason for that (which I’ll get into below). Yesterday when speaking in a real estate office someone asked, “Ryan, has the market not been as slow this year? It seems like it.” And my answer was, “You’re exactly right.” Granted, we’re still seeing signs of a traditional seasonal slowing, but the market has felt more vibrant than usual. This is actually the type of trend we had in 2017 where many real estate professionals said things like, “It seemed like the market just kept going.” Well, technically the market did slow, but I understand why people said that.

DOWNLOAD 90 visuals: Please download all graphs here as a zip file. See my sharing policy for 5 ways to share (please don’t copy verbatim).

THE SHORT VERSION:

  • It’s not that dull
  • The numbers are hot technically
  • A new tech company in town
  • FHA on the prowl
  • Stop waiting for multiple offers
  • Rent control communication
  • Kurt Cobain’s house
  • Fewer multiple offers this season
  • How to find school boundaries
  • California price record
  • Sellers are still disconnected

THE LONGER VERSION:

Here are some of the bigger topics right now:

Not that dull: Last year many thought the market was at a tipping point because it just felt dark. Sales volume was slumping in a big way and inventory was spiking as buyers stepped back from the market. But today things feel much different in light of low mortgage rates changing the feel of the market. In fact, most price metrics have seemed flat this fall and it took eight less days to sell this November compared to last year at the same time.

Sifting hot numbers: Price metrics have been more glowing lately, but I advise taking these with a grain of salt. The thing is last year the stats were depressed, so when we compare normal numbers today with dismal stats then, it tends to make things look really hot. My advice? Over these next few months be aware of more sensational data due to lackluster stats from last year. Otherwise if we’re not careful we might end up thinking the market is much hotter than it actually is.

A new tech company in town: There’s yet another new tech company playing the local market. This time it’s an outfit called Reali, which appears to be a discount brokerage, but they say they have AI too. Thanks to Mudge on Twitter for the photo of this listing in East Sac.

FHA has been up: For years FHA has been shrinking because there are more conventional products that can readily compete with FHA. But these past few months we’ve seen a bit of an uptick in FHA. This is nothing massive, but it’s worth noting and maybe indicative of an appetite among first-time buyers to get into the market. Last month 21% of sales were FHA in Sacramento County and this past month we saw 19% of all sales. This is up slightly from FHA tending to hover closer to 17-18% or so for the past couple of years. Again, this isn’t something major, but my curiosity is at least piqued.

Accept the offer: We are not in a market with a crazy number of multiple offers. This is exactly what the stats show. Here’s a look at the number of offers among all current pending sales. My advice to sellers? If you get one reasonable offer, it’s probably time to accept it rather than waiting for a mythical unicorn buyer to swoop in and pay more.

Uh, rent control communication: Rent control is a new dynamic and there is going to be a learning curve when it comes to communicating about it. Just yesterday I spotted several listings that mentioned how rents can be raised or how rent control didn’t apply. My advice? Know the letter of the law and how it’s going to be different in the City of Sacramento as well as California. Locally we have two different sets of rent control to consider, and they are similar but not the same. In case it’s useful I did a rent control Q&A a few weeks back. This isn’t a super sexy topic to read about because it’s technical. But these details matter and for anyone who works in real estate it’s time to know the fine print.

Doesn’t smell like teen spirit (hopefully): Kurt Cobain’s former house in Seattle is for sale at $7.5 million. As a guy who loves 90s music I’m definitely watching this. If you’re interested, here’s a history of sales, permits, and other stuff from the Assessor. Remember, if you buy a house that is famous because of a former occupant or something that happened there, you might have people coming by. In fact, here’s a picture I took while visiting Seattle a couple years ago. By the way, think of the marketing opportunities…. “Come as you are,” or “Nevermind about other homes…”

Fewer multiple offers: There’s been fewer multiple offers lately, but that’s a normal part of the fall season. At this time of year there’s simply not as many eyeballs on listings which means there’s also fewer offers. This underscores exactly how important it is to price for the market that actually exists today rather than the more aggressive trend in the spring.

School boundaries: Here’s a quick screencast I put together for a friend on how to find school boundaries. This can come in handy to be able to quickly find boundaries for all schools (not just the district). This can matter at times for pulling comps too.

California new high price record: We have a new record in California as the “Beverly Hillbillies” mansion sold for about $150M. No, this doesn’t mean your property is worth more now. The highest residential sale ever in the United States is an apartment in New York at $238M (it was several apartments combined actually). I’ve read about a flip in SoCal that is supposed to come to the market eventually for $500M…. We’ll see.

Disconnected sellers: Last but not least, sellers are still lagging behind the trend. What I mean is the market has slowed, but sellers are stuck in the past and expecting to command lofty prices from super hungry Bay Area Buyers. They think everything is selling cash too when in fact only 15% of the market was cash last month. It’s like sellers are showing up to a party with Z Cavaricci pants and “Can’t Touch This” t-shirts. They didn’t get the memo that style has changed… Okay, that got weird.

News 10: If you think this post is absurdly long already, you’re right. Here’s a piece I did on News 10 this morning though on gentrification in Oak Park. I pulled some cool stats and honestly I was pretty excited to see my stats so large on the screen too. Haha.

I could write more, but let’s get visual instead.

FIVE THINGS TO TALK ABOUT:

1) SLOWER GROWTH (with an asterisk): Price growth has been slowing. It’s what the stats are telling us. Though technically the monthly and quarterly data below show higher price growth this year. But take this with a grain of salt because the market was REALLY dull last year. So when we compare numbers this year with dismal stats from the last half of 2018 it tends to inflate the numbers today.

2) PRICE CYCLES: Here’s a look at the past few price cycles in various counties. This is a fascinating way to see the market. What do you notice?

3) LAST YEAR vs THIS YEAR: All year long most price metrics have been up about 2-4% each month compared to last year, but these past two months they’ve been higher. This is likely due to stats sagging last year during a really dull 2018 fall season. Additionally, mortgage rates went down a few months ago and we’re likely seeing some of the effect of that.

4) VOLUME SLUMP: We’ve been having a definitive sales volume slump since mid-2018, but lately volume has been stronger. In other words, sales volume has been up for three out of the past five months. This is something to keep on the radar. It’s not a volume meltdown, but it’s definitely been a slower year.

5) LAST MONTH vs THIS MONTH: The market looks pretty flat in some categories from October to November. But in other ways we still see the market slowing. For anyone who says we are not having a seasonal slowing, please look closely at all the images in this post. We are. It just hasn’t been as dull as some other fall seasons.

NOTE: Take El Dorado County data with a grain of salt. Stats change significantly month by month. Also, if you’re in Placer, be careful about only looking to Placer data because limited sales can mean numbers jump around quite a bit from month to month.

Thanks for respecting my content: Please don’t copy my post verbatim or alter the images in any way. I will always show respect for your original work and give you full credit, so I ask for that same courtesy. Here are 5 ways to share my content.

Please enjoy more images now.

SACRAMENTO REGION (more graphs here):

SACRAMENTO COUNTY (more graphs here):

PLACER COUNTY (more graphs here):

EL DORADO COUNTY (more graphs here):

DOWNLOAD 90 visuals: Please download all graphs here as a zip file. See my sharing policy for 5 ways to share (please don’t copy verbatim).

Questions: What sort of predictions are you hearing (or making) right now? What stands out to you about the market? Anything to add?

If you liked this post, subscribe by email (or RSS). Thanks for being here.

Share:

  • Click to share on Twitter (Opens in new window)
  • Click to share on Facebook (Opens in new window)
  • Click to share on LinkedIn (Opens in new window)

Filed Under: Market Trends Tagged With: prices, real estate predictions, real estate prophets, rent control, Sacramento Appraisal Blog, sacramento housing market, Sacramento real estate trends, slumping sales volume, tame fall season, trend graphs

Solar panels & a normalish spring market

May 15, 2019 By Ryan Lundquist 17 Comments

Every week I get asked about solar panels. Do they add value? Should I price my listing higher? Will buyers pay for it? These are big questions and there’s no quick answer. But here are some things I think through and bring up when people call. This is just over ten minutes. Then for those interested, I have a huge market update to talk through the kinda sorta normal spring market.

Solar Video: Watch the video by clicking the image above (or here).

A Podcast I did with Norm: If solar isn’t your thing and you need a podcast to listen to, I just talked with Norm Shriever about appraisals, owning islands, Zillow, my Dad bod, etc… Listen directly on YouTube if you wish.

As always, thanks for being here.

—–——– Big local monthly market update (long on purpose) —–——–

Spring is feeling fairly normal so far. What a difference from the doom we felt in the latter half of 2018. Let’s talk about it.

THE SHORT VERSION:

  • Prices are up from the fall
  • Prices aren’t up much from last year
  • There’s lots of competition if priced right
  • Sales volume has slumped for 11 months
  • There are 2,500 less sales this year
  • So far the spring has felt fairly normal
  • This post is long on purpose. Skim or pour a cup of coffee.

DOWNLOAD 80+ visuals: Please download all graphs here as a zip file. See my sharing policy for 5 ways to share (please don’t copy verbatim).

THE LONGER VERSION:

Here are some of the bigger topics right now:

It feels flat around here: Prices are definitely up from the big lull we had during the fall season, but they’re not up by much compared to last year. This is why I’ve been describing the market as flat. Most price metrics in the region are up only 2-3% over the year. In the region we’re seeing prices about level with the height of last year, though in Sacramento County we’re slightly above. This could obviously vary by neighborhood.

A more normal spring: I was talking to a real estate agent today and she said, “You know, it just feels like a normal spring.” I tend to agree. Stats are showing normalcy and we’re seeing what we’d expect to see at this time of year. Prices are up, inventory is down, sales volume has ticked up from the fall, it’s taking less time to sell, and pending sales have been strong. This doesn’t mean the market is perfectly healthy, but from a stats perspective it’s been fairly normal.

2,500 less sales this year: On one hand sales volume has recovered this spring to almost normal levels, but over the past year volume is actually down 8.5% in the region. I know that doesn’t sound like much, but think about it this way. There were 2,500 less sales this year in the region compared to last year. While this isn’t the sign of a market meltdown, it’s definitely something we have to watch. At best I would say this is an off year, and at worst it’s a symptom of the market starting to change in more significant ways (which we will only know as time unfolds). In short, don’t write home over this yet, but keep an eye on it.

Zillow: Last week Zillow announced they’ll be entering the Sacramento market by the end of the year. This is huge news, but it’s really what we expected. These days there are a handful of tech companies trying to challenge the traditional real estate model by buying privately from sellers and then re-listing on the open market. There’s lots to say about this and I’ll have some posts in the future. For now I just wanted to say I find it ironic that as much as Zillow loves to tout their accuracy rate, they won’t be buying properties based on the Zestimate. Otherwise I imagine lots of overvalued owners would jump at the opportunity, right?

Low rates are the x-factor: At the end of 2018 it seemed like the market was ready to take a dive, but lower rates this year have helped bring buyers back into the market and sustain higher prices.

Real estate is like the stock market: When I say the market is slower I get a little pushback at times. The idea is, “Dude, I just had 14 offers on my house. How dare you say the market is slow!!!” Look, it’s impossible to describe every neighborhood and price range with just one statement. This is why I say the real estate market is like the stock market. While the market as a whole might be doing one thing, not every stock is experiencing that same exact trend. In the same way, not every neighborhood, price range, or property type can be explained the same way.

Do cannabis dispensaries increase residential value? I did an interview last week with CBS 13 to talk about a study that claims cannabis dispensaries increase the value of surrounding residential properties. You can click the link to hear my take. In short, it’s true that vibrant commercial sectors can help increase value. But I’ve never met a buyer who said, “I’ll pay more because of a dispensary down the street.” In my experience locally at least, many people don’t even know dispensaries are there unless they’re cannabis connoisseurs. In short, I tend to be skeptical of studies like this.

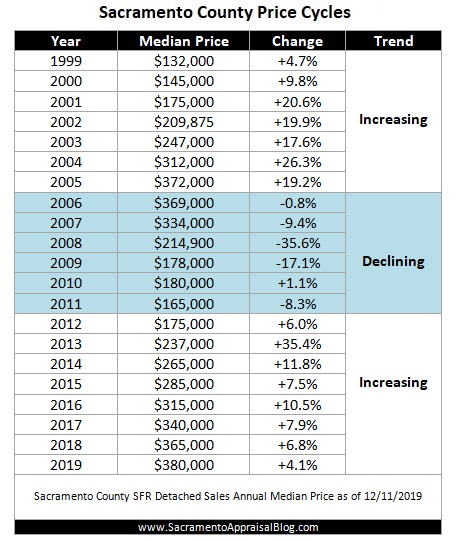
Hey girl, let’s have bubble talk: Prices are just about back to where they were fourteen years ago when the market collapsed in 2005. In fact, most price metrics in Sacramento are within 1-3% of the peak. This means with just a little more modest price growth we might be having “Hey girl, we’re back” (yes, that was a Ryan Gosling reference (sorry)).

Keep in mind the market in 2005 was much different than today and there is no such thing as a formula where the market “pops” if we reach 2005 levels. Technically speaking, current values aren’t actually anywhere near 2005 when we consider inflation. But you know, very few buyers actually think about inflation like this – unless they’re economists, grad students, real estate geeks, etc…. In case it helps, here’s a post I wrote about buyers worried about another housing bubble.

Appraisals coming in lower: I’m hearing from some contacts of appraisals coming in lower than the contract price. As the market slows, this is something we’ll likely see more frequently if properties are getting into contract at prices that cannot be supported by market data. Of course some appraisals may legitimately come in too low, and I’m not naive about that. Whatever the case, I’d advise sellers to price realistically and in some cases pick the strongest offer instead of the highest one.

Price sensitivity: Literally half of all homes last month had multiple offers in the Sacramento Region. This reminds us buyers need to bring strong offers. But sellers ought to price correctly too. Buyers are not desperate and willing to pay unrealistic prices, so I advise aiming for the market instead of that one mythical buyer who will overpay for some reason. Remember, the market is very competitive, but that doesn’t mean prices are going crazy. 

I could write more, but let’s get visual instead.

FOUR BIG ISSUES TO WATCH:

1) SPRING GETTING HOT: The market is heating up for 2019. We’re seeing price changes, lower inventory, and increased sales volume. So prices are up from the dull fall, but they’re also flat as you can see under #4.

2) SLOWING MOMENTUM: Despite the heating, stats show the market is slowing down when we look at the rate of change by year. Looking at monthly, quarterly, and annual numbers helps give a balanced view of things.

3) SALES VOLUME SLUMP for 11 months: It’s important to look at sales volume in a few ways to get the bigger picture. Here it is by month and year.

SACRAMENTO REGION:

Key Stats:

  • April volume down 8.2%
  • Volume is down 8.5% over the past 12 months

SACRAMENTO COUNTY:

Key Stats:

  • April volume down 6.8%
  • Volume is down 7.2% over the past 12 months

PLACER COUNTY:

Key Stats:

  • April volume down 4.3%
  • Volume is down 8.9% over the past 12 months

EL DORADO COUNTY:

Key Stats:

  • April volume down 2.4%
  • Volume is down 12.5% over the past 12 months

4) LAST YEAR VS THIS YEAR: Check out the price metrics below. Can you see why I’m saying prices seem flat lately? This may not be true in every single price range or neighborhood of course, but this shows us price momentum is slowing. With that being said, it’s still okay to say the market is “hot”. It is. But I’d say competition is hotter than price appreciation.

NOTE: Take El Dorado County data with a grain of salt. Stats change significantly month by month.

Quick note on how NOT to use my content: Please don’t copy my post verbatim or alter the images in any way. I will always show respect for your original work and give you full credit, so I ask for that same courtesy. Here are 5 ways to share my content.

Now here are a bunch of images. Please enjoy.

SACRAMENTO COUNTY (more graphs here):

SACRAMENTO REGION (more graphs here):

PLACER COUNTY (more graphs here):

EL DORADO COUNTY (more graphs here):

DOWNLOAD 80+ visuals: Please download all graphs here as a zip file. See my sharing policy for 5 ways to share (please don’t copy verbatim).

Questions: What are you seeing out there? What do you think prices are doing? What are you hearing from buyers and sellers lately?

If you liked this post, subscribe by email (or RSS). Thanks for being here.

Share:

  • Click to share on Twitter (Opens in new window)
  • Click to share on Facebook (Opens in new window)
  • Click to share on LinkedIn (Opens in new window)

Filed Under: Market Trends Tagged With: appraisals in Sacramento, El Dorado County, housing stats in Sacramento, low interest rates, momentum slowing, Norm Shriever, normal spring season, Placer County, prices, Sacramento County, Sacramento Reginal Appraisal Blog, sacramento regional housing market, sales volume, Solar panels, trend graphs, Zillow buying in Sacramento

Making the numbers say what we want (and a Sacramento market update)

September 13, 2016 By Ryan Lundquist 18 Comments

We can make numbers say whatever we want. We see this all the time in the media, politics, and even in real estate. Sometimes it’s a matter of intentionally fudging the numbers, but other times we might be honest about sharing something but actually still get it totally wrong. Today I want to highlight a real life example how we can end up saying something totally different about the market depending on the numbers we’re looking at. Whether you’re local or not, I hope you can take something away from this post. Then for those interested we’ll dive into a big Sacramento market update. Any thoughts? I’d love to hear your take.

Example 1: Sales price to list price ratio:

sold-vs-list-price-percentage-in-sacramento-county

The sales vs. list price percentage is the ratio between the sales price and whatever the most recent list price was before a property got into contract. For example, imagine a property listed at $100,000, was reduced to $98,000, and then went into contract at $98,000. The sales to list price would be 100% (98/98). If we look at this metric alone and see a county average of 100%, it looks like properties are selling for whatever they’re listed for. Woohoo, the market is hot!!!

Example 2: Sales price to ORIGINAL list price ratio:

sales-price-to-original-list-price-in-sacramento-county-by-sacramento-appraisal-blog

The sales to original list price ratio is the relationship between the original list price and the final sales price. For example, imagine a property listed at $100,000 but was reduced to $98,000, and then went into contract at $96,000. The sales to list price ratio would be 96% (96/100). This metric takes into account ALL price reductions, and in my mind tells a more fuller story of the market.

KEY QUESTION: Which one above does your CMA report?

BIG POINT: If we look at the sales price to list price ratio the market seems like it’s NOT softening. But if we take a deeper look at the sales price to ORIGINAL list price ratio, we see properties on average sold for 4% less than their original list price last month. This is definitely a more telling stat because it reminds us how many properties have been overpriced lately. Remember, there were nearly 1800 sales last month, so an average 4% decline is a big stat. But it’s easy to miss that if we don’t know what to look for and end up reporting the first stat above.

—-—–—– And here’s my big monthly market update  ———–—–

big-monthly-market-update-post-sacramento-appraisal-blog-image-purchased-from-123rfTwo ways to read the BIG POST:

  1. Scan the talking points and graphs quickly.
  2. Grab a cup of coffee and spend time digesting what is here.

DOWNLOAD 70 graphs HERE: Please download all graphs in this post (and more) here as a zip file. Use them for study, for your newsletter, or some on your blog. See my sharing policy for 5 ways to share (please don’t copy verbatim). Thanks.

Quick Market Summary: The market feels like it should at this time of year. It’s taking slightly longer to sell than it was a couple of months ago, the sales to original list price ratio has been declining, and prices are softening as the hot summer fades away. This doesn’t mean the market is dull at every price range though. In fact, the bottom of the market under $300,000 is definitely more aggressive than properties above $500,000. Right now housing inventory is 11% lower than it was the same time last year and a whopping 35% lower than it was in 2014. If you remember, two years ago the market felt extremely dull and there were about 400 price reductions every day when logging in to MLS (this year price reductions are hovering around 200 tops every day (that’s for the entire MLS coverage area)). This reminds us some fall markets are softer than others. Sales volume this year has been about the same as it was last year, though it’s important to note FHA is down 6% and cash is down over 8% so far. Celebrity house flipping seminars are coming to town frequently in Sacramento, but keep in mind only 2% of all sales in the region last month were bank-owned, which reminds us low-priced fixer deals on MLS are pretty much a thing of the past. Lastly, there has been lots of talk about the market having shifted or beginning a downturn, but right now the stats look to be showing a normal seasonal slowing. We often hear things like, “the market is starting to tank”, but unless we see a real change in the stats or hear something more definitive from the real estate community about values declining, let’s be in tune with the slowing seasonal market. In case it’s useful, here is a video tutorial I did a couple of weeks ago to walk through the slowing season and what it looked like in 2005 also.

Sacramento County:

  1. The median price is 102% higher than it was in early 2012.
  2. Sales volume was up 8.5% this August compared to August 2015.
  3. There were only 4 sales under $100K last month (single family detached).
  4. Sales volume is up about 4% this year compared to last year.
  5. Housing inventory is 11% lower than the same time last year (only 1.57 months of inventory).
  6. FHA volume is down about 6% this year compared to 2015 (though they were 26% of all sales last month).
  7. Cash sales were only 14% of all sales last month.
  8. It took an average of 26 days to sell a home last month, which is 1 day less than the previous month (and 8 less days compared to last year).
  9. REOs were only 3% of all sales last month and short sales were 2.8%.
  10. The median price increased by 1% from last month, is down 3% from two months ago, and is up nearly 12% from last year at the same time.

Some of my Favorite Graphs this Month:

inventory-in-sacramento-county-since-2013-part-2-by-sacramento-appraisal-blog

median-price-context-in-sacramento-county

median-price-since-2013-in-sacramento-county

price-metrics-since-2015-in-sacramento-county-look-at-all

inventory-august-2016-by-home-appraiser-blog

cdom-in-sacramento-county-by-sacramento-regional-appraisal-blog

sales-volume-in-sacramento-county-since-2012

SACRAMENTO REGIONAL MARKET:

  1. The median price is 98.5% higher than it was in early 2012.
  2. It took the same time to sell last month compared to the previous month (but 8 less days compared to August 2015).
  3. Sales volume is about the same as it was last year at the same time (very slightly more this year so far)
  4. Cash sales were 15% of all sales last month.
  5. Cash sales volume is 6.4% lower this year than last year.
  6. FHA sales were 22% of all sales last month.
  7. FHA sales volume is down nearly 7% this year so far.
  8. There is 1.77 months of housing supply in the region right now, which is over 13% lower than the same time last year.
  9. The median price increased last month, but it’s down from two months ago. The median price is up nearly 9% from last year at the same time. The average sales price and average price per sq ft are both up about 8% from last year too.
  10. REOs were only 2% of all sales last month and short sales were the same.

Some of my Favorite Regional Graphs:

median-price-sacramento-placer-yolo-el-dorado-county

regional-inventory-by-sacramento-regional-appraisal-blog

sacramento-region-volume-fha-and-conventional-by-appraiser-blog

days-on-market-in-placer-sac-el-dorado-yolo-county-by-sacramento-appraisal-blog

number-of-listings-in-sacramento-regional-market

interest-rates-inventory-median-price-in-sacramento-regional-market-by-sacramento-appraisal-blog-market

number-of-listings-in-placer-yolo-el-dorado-sacramento-by-home-appraiser-blog

PLACER COUNTY:

  1. Today’s median price is 70% higher than it was in early 2012.
  2. It took 4 more days to sell a house last month than the previous month (but 6 less days than last year at the same time).
  3. Sales volume was down less than 1% in August 2016 compared to last August and is down slightly for the year about 3%.
  4. Both FHA sales were 16% and cash sales were 19% of all sales last month.
  5. There is 2.05 months of housing supply in Placer County right now, which is down nearly 13% from the same time last year.
  6. The median price declined about 1% from the previous month, but for a better context it’s up 7% from last year at the same time.
  7. The average price per sq ft was $214 last month (was $202 last year at the same time).
  8. The average sales price was $472K last month (up about 4% from last year).
  9. Bank owned sales were only 1% of all sales last month.
  10. Short sales were 2% of sales last month.

Some of my Favorite Placer County Graphs:

placer-county-median-price-since-2014-part-2-by-home-appraiser-blog

placer-county-housing-inventory-by-home-appraiser-blog

months-of-housing-inventory-in-placer-county-by-sacramento-appraisal-blog

number-of-listings-in-placer-county-2016

days-on-market-in-placer-county-by-sacramento-appraisal-blog

placer-county-sales-volume-by-sacramento-appraisal-blog

DOWNLOAD 70 graphs HERE: Please download all graphs in this post (and more) here as a zip file. Use them for study, for your newsletter, or some on your blog. See my sharing policy for 5 ways to share (please don’t copy verbatim). Thanks.

how-to-think-like-an-appraiser-class-by-ryan-lundquistAppraisal Class I’m teaching: On September 29 from 9am-12pm I’m doing my favorite class at SAR called HOW TO THINK LIKE AN APPRAISER. This is a tremendous time where we’ll talk about seeing properties like an appraiser does. We’ll look at comp selection, using price per sq ft properly, and so many issues. My goal is to help you walk away glad you came and full of actionable ideas for business. Register here.

Question: Did I miss anything? Any other market insight you’d like to add? What are you seeing out there? I’d love to hear your take.

If you liked this post, subscribe by email (or RSS). Thanks for being here.

Share:

  • Click to share on Twitter (Opens in new window)
  • Click to share on Facebook (Opens in new window)
  • Click to share on LinkedIn (Opens in new window)

Filed Under: Market Trends Tagged With: cooling market, El Dorado County, FHA, foreclosures, Home Appraiser, House Appraiser, inventory, market trends in Sacramento, Placer County, prices, Sacramento County, sacramento housing market, sacramento regional housing market, sales volume, Short Sales, Yolo County

  • Go to page 1
  • Go to page 2
  • Go to Next Page »

Primary Sidebar

Connect with Ryan

 Facebook Twitter LinkedIn YouTube Instagram

Subscribe to Weekly Post

* indicates required

Search this site

Blog Categories

  • Appraisal Stuff (407)
  • Bankruptcy (3)
  • Divorce (4)
  • Estate Settlement (6)
  • FHA Appraisal Articles (56)
  • Internet (53)
  • Market Trends (476)
  • Photos from the Field (126)
  • Property Taxes (70)
  • Random Stuff (231)
  • Resources (566)
  • Videos (161)

Blog Archives: 2009 – 2021

Lundquist Appraisal Links

  • Appraisal Order Form
  • Appraisal Website
  • Rancho Cordova Appraiser Website
  • Sacramento Appraisal Blog Sitemap
  • Sacramento Real Estate Appraiser Facebook Page
  • Twitter: Sacramento Appraiser (@SacAppraiser)
  • YouTube: Sacramento Appraiser Channel

Most Recent Posts

  • My new sewer line adds huge value, right?
  • The housing market nobody predicted
  • Real estate trends to watch in 2021
  • You carried me & a spreadsheet for Christmas
  • Real estate drama (and a market update)
  • Goodbye California. Is everyone leaving?
  • How much are buyers paying above the list price?
  • What would happen to the housing market if we went on lockdown again?
  • Overpricing, multiple offers, & hot ranges
  • Why your home isn’t worth 16% more today

Disclaimer

First off, thank you for being here. Now let's get into the fine print. The material and information contained on this website is the copyrighted property of Ryan Lundquist and Lundquist Appraisal Company. Content on this website may not be reproduced or republished without prior written permission from Ryan Lundquist.

Please see my Sharing Policy on the navigation bar if you are interested in sharing portions of any content on this blog.

The information on this website is meant entirely for educational purposes and is not intended in any way to support an opinion of value for your appraisal needs or any sort of value conclusion for a loan, litigation, tax appeal or any other potential real estate or non-real estate purpose. The material found on this website is meant for casual reading only and is not intended for use in a court of law or any other legal use. Ryan will not appear in court in any capacity based on any information posted here. For more detailed market analysis to be used for an appraisal report or any appraisal-related purpose or valuation consulting, please contact Ryan at 916-595-3735 for more information.

There are no affiliate links on this blog, but there are three advertisements. Please do your homework before doing business with any advertisers as advertisements are not affiliated with this blog in any way. Two ads are located on the sidebar and one is at the bottom of each post. The ads earn a minor amount of revenue and are a simple reward for providing consistent original content to readers. If you think the ads interfere with your blog experience or the integrity of the blog somehow, let me know. I'm always open to feedback. Thank you again for being here.

Copyright © 2021 Sacramento Appraisal Blog