Buckle up and let’s take a drive through the past 20 years. Where has the market been over these two decades? Since MLS recently made it much easier to extract older data, I had to do this post. I hope you find it useful or interesting – even if you aren’t in the Sacramento market.

SOME THINGS TO KEEP IN MIND:
1) Data: We are only as good as our data and our ability to understand. Some graphs below are very clear in their trends, but others probably aren’t meaningful because of massive data or an enormous price range.
2) Not back: Many lower-priced areas are not back to their price peak in 2005.
3) Back: Some well-established areas have exceeded previous peaks.
4) Different trends: Not all price ranges, locations, and property types have moved the same way, so let’s be cautious about sweeping generalizations about the entire market. After all, the condo market might be far different from the 2-4 unit market or vacant land.
5) Inflation: Prices might be similar today to where they were in 2005, but that doesn’t mean values are the same. I know, that’s so technical, but when we factor in inflation over 13 years, it’s really not the same thing when comparing today’s prices with prices from 13 years ago. Keep in mind the market today has far different dynamics from 2005 also.
6) Bubble: Graphs like this can often lead to conversations about a housing “bubble.” If it’s relevant, please read peak prices and an open letter to buyers worried about another housing bubble.

SIDE NOTE: I’ve been having major website issues over the past 2 months. I’ve switched hosts, and that should solve the problem of down time.
DOWNLOAD ALL GRAPHS: You can download all images as a zip file. I included both a web-friendly size and larger ones. Please use as you see fit (unaltered). If you post somewhere online I always appreciate a link back.
Rosemont:

River Park:

Meadowview:


Vacant Residential Land:

Million Dollar Sales:


Pocket / Greenhaven:

Rancho Cordova:

Sierra Oaks:


Loomis:

East Sacramento:


Duplex Sales:

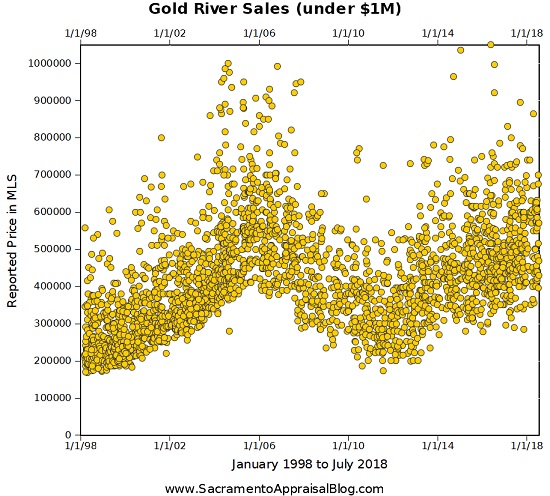
Gold River:
Land Park:


Elk Grove:


Garden of the Gods:

Sales under $50K in Sacramento County:

Del Paso Manor:

Tahoe Park:

Fair Oaks:


Treelake / Ashley Woods (Granite Bay):

Condo Sales in Sacramento County (and Downtown):


Colonial Heights:

College Glen:

Davis:

West Sacramento:


Bella Vista High School Boundaries:

Arden Park:

Folsom:

Arden Manor:

95815 Zip Code:

4-Unit Sales in Sacramento County:


Roseville:


I hope this was interesting or even fascinating. I’m intrigued and excited about having more data at my disposal (thank you Metrolist). Thanks everyone for your graph suggestions too. I reached out on Facebook, Twitter, and LinkedIn and got to most of what people asked for, though I couldn’t do them all.
Questions: What are your thoughts about the market after seeing the graphs above? I’d love to hear your take.
If you liked this post, subscribe by email (or RSS). Thanks for being here.


 While initially some of her stats seem startling, I do think she is right that trees add to the overall value of a property. This doesn’t mean a house is automatically worth 2 or 9% more due to having the tree set-up she mentioned, but trees generally do yield a value contribution. In an objective sense, trees add worth due to boosting energy efficiency due to shade, while there is also a subjective element where they tend to increase curb appeal among buyers. It’s hard to ignore that some of the most highly priced and sought-after streets in the Sacramento area are lined with enormous trees. Think the Fabulous 40s, Curtis Park, Land Park or Arden Park to name just a few. Granted, these streets typically have very large and well-maintained houses too, but there is no mistaking that a canopy of mature trees stretching along a particular street tends to give a very positive impression to buyers in the market for that street in comparison to others. Agree? Disagree?