Buckle up. It’s real estate prophet season where everyone and their Mom has a prediction about the market next year. Here are some quick thoughts and then a deep dive into local trends for anyone interested.
1) Nothing too extreme: So far I’m not hearing too many extreme views on the housing market. What I mean is there aren’t as many voices saying, “It’s going to tank” or “We’re going to have massive increases.” For instance, here’s a forecast from Realtor.com and it’s pretty mild. Very little price growth and a dip in the number of sales too. For reference, I wouldn’t base my perception of the market on any forecast.

2) Consumer thoughts & Twitter: I asked Twitter to predict and people seemed to mostly think prices would be flat or modest. This isn’t anything scientific, but the results don’t surprise me based on conversations I’ve been having. If you work in real estate, ask people what they think. But be careful about opinions formed from headlines instead of local data.

3) Beware of the prophets: Spoiler alert. Nobody knows what the market is going to do, so beware of false real estate prophets who predict the same thing every year and then repackage their predictions for the new year. My advice? Don’t lose credibility by trying to predict the future. It’s okay to say, “My crystal ball is broken, but I can tell you what the market is doing right now.” This doesn’t mean we don’t have ideas where things might go based on current data, but it does mean we’re ultimately humble about our ability to predict the future.

And now ironically here’s a piece from the Sacramento Bee on where the market is heading in 2020 (behind a paywall). I was asked to pitch in some thoughts and I did. Of course like a broken record I always start a media interview like this with, “My crystal ball is broken…. Here are some things to consider.”
Any thoughts?
—–——– Big local market update (long on purpose) —–——–
This post is designed to skim or digest slowly.
Summary: Some fall seasons are really dull, but this hasn’t been one of them. In fact, if you’re looking for a slogan right now it could be, “Hey man, it’s not that dull.” The numbers look pretty hot too, but there’s a reason for that (which I’ll get into below). Yesterday when speaking in a real estate office someone asked, “Ryan, has the market not been as slow this year? It seems like it.” And my answer was, “You’re exactly right.” Granted, we’re still seeing signs of a traditional seasonal slowing, but the market has felt more vibrant than usual. This is actually the type of trend we had in 2017 where many real estate professionals said things like, “It seemed like the market just kept going.” Well, technically the market did slow, but I understand why people said that.
DOWNLOAD 90 visuals: Please download all graphs here as a zip file. See my sharing policy for 5 ways to share (please don’t copy verbatim).
 THE SHORT VERSION:
- It’s not that dull
- The numbers are hot technically
- A new tech company in town
- FHA on the prowl
- Stop waiting for multiple offers
- Rent control communication
- Kurt Cobain’s house
- Fewer multiple offers this season
- How to find school boundaries
- California price record
- Sellers are still disconnected
THE LONGER VERSION:
Here are some of the bigger topics right now:
Not that dull: Last year many thought the market was at a tipping point because it just felt dark. Sales volume was slumping in a big way and inventory was spiking as buyers stepped back from the market. But today things feel much different in light of low mortgage rates changing the feel of the market. In fact, most price metrics have seemed flat this fall and it took eight less days to sell this November compared to last year at the same time.
Sifting hot numbers: Price metrics have been more glowing lately, but I advise taking these with a grain of salt. The thing is last year the stats were depressed, so when we compare normal numbers today with dismal stats then, it tends to make things look really hot. My advice? Over these next few months be aware of more sensational data due to lackluster stats from last year. Otherwise if we’re not careful we might end up thinking the market is much hotter than it actually is.
A new tech company in town: There’s yet another new tech company playing the local market. This time it’s an outfit called Reali, which appears to be a discount brokerage, but they say they have AI too. Thanks to Mudge on Twitter for the photo of this listing in East Sac.

FHA has been up: For years FHA has been shrinking because there are more conventional products that can readily compete with FHA. But these past few months we’ve seen a bit of an uptick in FHA. This is nothing massive, but it’s worth noting and maybe indicative of an appetite among first-time buyers to get into the market. Last month 21% of sales were FHA in Sacramento County and this past month we saw 19% of all sales. This is up slightly from FHA tending to hover closer to 17-18% or so for the past couple of years. Again, this isn’t something major, but my curiosity is at least piqued.
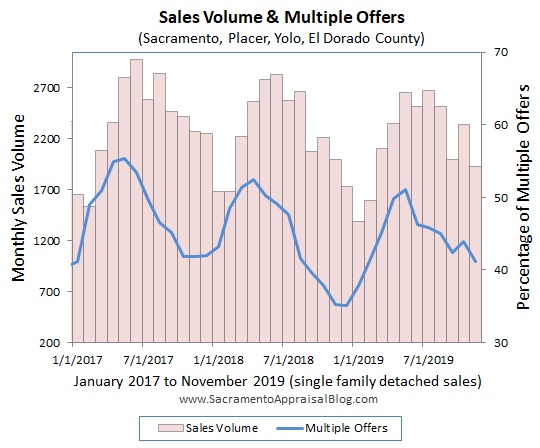
Accept the offer: We are not in a market with a crazy number of multiple offers. This is exactly what the stats show. Here’s a look at the number of offers among all current pending sales. My advice to sellers? If you get one reasonable offer, it’s probably time to accept it rather than waiting for a mythical unicorn buyer to swoop in and pay more.

Uh, rent control communication: Rent control is a new dynamic and there is going to be a learning curve when it comes to communicating about it. Just yesterday I spotted several listings that mentioned how rents can be raised or how rent control didn’t apply. My advice? Know the letter of the law and how it’s going to be different in the City of Sacramento as well as California. Locally we have two different sets of rent control to consider, and they are similar but not the same. In case it’s useful I did a rent control Q&A a few weeks back. This isn’t a super sexy topic to read about because it’s technical. But these details matter and for anyone who works in real estate it’s time to know the fine print.
Doesn’t smell like teen spirit (hopefully): Kurt Cobain’s former house in Seattle is for sale at $7.5 million. As a guy who loves 90s music I’m definitely watching this. If you’re interested, here’s a history of sales, permits, and other stuff from the Assessor. Remember, if you buy a house that is famous because of a former occupant or something that happened there, you might have people coming by. In fact, here’s a picture I took while visiting Seattle a couple years ago. By the way, think of the marketing opportunities…. “Come as you are,” or “Nevermind about other homes…”

Fewer multiple offers: There’s been fewer multiple offers lately, but that’s a normal part of the fall season. At this time of year there’s simply not as many eyeballs on listings which means there’s also fewer offers. This underscores exactly how important it is to price for the market that actually exists today rather than the more aggressive trend in the spring.

School boundaries: Here’s a quick screencast I put together for a friend on how to find school boundaries. This can come in handy to be able to quickly find boundaries for all schools (not just the district). This can matter at times for pulling comps too.
California new high price record: We have a new record in California as the “Beverly Hillbillies” mansion sold for about $150M. No, this doesn’t mean your property is worth more now. The highest residential sale ever in the United States is an apartment in New York at $238M (it was several apartments combined actually). I’ve read about a flip in SoCal that is supposed to come to the market eventually for $500M…. We’ll see.
Disconnected sellers: Last but not least, sellers are still lagging behind the trend. What I mean is the market has slowed, but sellers are stuck in the past and expecting to command lofty prices from super hungry Bay Area Buyers. They think everything is selling cash too when in fact only 15% of the market was cash last month. It’s like sellers are showing up to a party with Z Cavaricci pants and “Can’t Touch This” t-shirts. They didn’t get the memo that style has changed… Okay, that got weird.
News 10: If you think this post is absurdly long already, you’re right. Here’s a piece I did on News 10 this morning though on gentrification in Oak Park. I pulled some cool stats and honestly I was pretty excited to see my stats so large on the screen too. Haha.

I could write more, but let’s get visual instead.
FIVE THINGS TO TALK ABOUT:
1) SLOWER GROWTH (with an asterisk): Price growth has been slowing. It’s what the stats are telling us. Though technically the monthly and quarterly data below show higher price growth this year. But take this with a grain of salt because the market was REALLY dull last year. So when we compare numbers this year with dismal stats from the last half of 2018 it tends to inflate the numbers today.


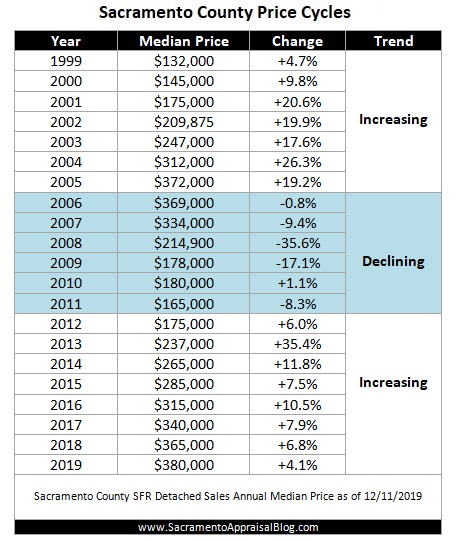
2) PRICE CYCLES: Here’s a look at the past few price cycles in various counties. This is a fascinating way to see the market. What do you notice?


3) LAST YEAR vs THIS YEAR: All year long most price metrics have been up about 2-4% each month compared to last year, but these past two months they’ve been higher. This is likely due to stats sagging last year during a really dull 2018 fall season. Additionally, mortgage rates went down a few months ago and we’re likely seeing some of the effect of that.


4) VOLUME SLUMP: We’ve been having a definitive sales volume slump since mid-2018, but lately volume has been stronger. In other words, sales volume has been up for three out of the past five months. This is something to keep on the radar. It’s not a volume meltdown, but it’s definitely been a slower year.


5) LAST MONTH vs THIS MONTH: The market looks pretty flat in some categories from October to November. But in other ways we still see the market slowing. For anyone who says we are not having a seasonal slowing, please look closely at all the images in this post. We are. It just hasn’t been as dull as some other fall seasons.


NOTE: Take El Dorado County data with a grain of salt. Stats change significantly month by month. Also, if you’re in Placer, be careful about only looking to Placer data because limited sales can mean numbers jump around quite a bit from month to month.
Thanks for respecting my content: Please don’t copy my post verbatim or alter the images in any way. I will always show respect for your original work and give you full credit, so I ask for that same courtesy. Here are 5 ways to share my content.
Please enjoy more images now.
SACRAMENTO REGION (more graphs here):


SACRAMENTO COUNTY (more graphs here):


PLACER COUNTY (more graphs here):


EL DORADO COUNTY (more graphs here):


DOWNLOAD 90 visuals: Please download all graphs here as a zip file. See my sharing policy for 5 ways to share (please don’t copy verbatim).
Questions: What sort of predictions are you hearing (or making) right now? What stands out to you about the market? Anything to add?
If you liked this post, subscribe by email (or RSS). Thanks for being here.


 THE SHORT VERSION:


