What’s the housing market going to do in 2024? Nobody has a crystal ball, but here are some emerging trends. Scroll quickly by topic or digest slowly.

UPCOMING (PUBLIC) SPEAKING GIGS:
01/12/24 Prime Real Estate (private event (I think))
01/17/24 Gateway Event (private)
01/31/24 Joel Wright & Mike Gobbi Event 9am (on Zoom here)
2/09/24 PCAR WCR Event (11:30am-1pm (more details))
2/13/24 Downtown Regional MLS Meeting 9am
3/11/24 Yolo Association of Realtors (YAR only)
3/26/24 Orangevale MLS meeting 9am
4/11/24 Lindsay Carlisle Event (private)
4/25/24 HomeSmart iCare Realty (details TBA)
NOTE: The housing market isn’t the same in every part of the country. I hope you get some value here, whether you’re local or not.

THINGS TO WATCH IN 2024:
The market will be far from normal: Last year we were missing a significant portion of both buyers and sellers, and this year is poised to be similar with low supply and low demand. The hope is to get some of each category back, but that hinges on what happens with rates, inflation, and the economy. Lately rates have gone down, and that has helped some, but we need to see a much bigger change to affordability to see a more meaningful difference in buyers and sellers participating. In other words, a modest dip in rates only creates modest results. If I had to guess, it’s possible we can see an uptick in buyers and sellers this year, but I don’t expect volume numbers to be anywhere close to normal. I could be wrong, but this is what stats are pointing toward. Time will tell.
The insurance crisis will become a bigger deal: It’s been a real mess with rising insurance rates in places like California and Florida in particular (lots of other areas too). Let’s watch how this affects homeowners, affordability for buyers, and investors with shrinking profit margins.
Vibrant new construction: The new homes market was glowing compared to the existing sales market last year in terms of volume, and this year builders are poised to do well again in light of a lack of supply in the existing resale market and the ability to buy down the mortgage rate.

Continued pressure on prices not crashing: I would expect to see a modest price uptick in the spring because that’s normal almost every year, but it’s hard to predict what prices will do the entire year with so much uncertainty, so I’m not even trying. But backing up, the market is in a weird place where supply and demand are really tight in the midst of a glaring lack of affordability. It would be very healthy to see prices come down, but supply has been way too tight to see prices crash. On that note, it was stunning to see volume at basically worst-ever 2007 levels last year locally, yet prices didn’t tank. Think about that. We saw some of the worst volume ever despite population growth since 2007, but prices didn’t plunge dramatically. Frankly, I thought prices were poised to go down more significantly in 2023, but then 40% of the normal number of listings did NOT come to the market, and that changed the trend. I had a local city councilmember ask me about this. The idea was, “Why haven’t prices plummeted? I thought that would be happening.” Well, supply is artificially constrained from Fed policy, and having such anemic supply has helped keep prices higher. It’s abnormal to see this dynamic of low supply and low demand. The trend would be much different if we had high supply and low demand.
NOTE: This doesn’t mean prices can only go up in the future, and I’m not a fan of that narrative since we are in new territory here with so many sellers sitting. I’m just saying prices thus far haven’t been able to crash like so many have wanted or predicted because the market has been so tight. Prices could easily decline if rates tick up instead of go down, so rates are quite the x-factor in what prices do this year.
Off-market transactions will be a thing: I don’t have an easy way to gauge off-market deals, but anecdotally they seem to have increased last year. My sense is the market got really tight, and some sellers didn’t want traffic through their homes, and some buyers out of desperation were finding transactions before they hit MLS. I expect this to continue in 2024 as long as supply and demand remain compressed.

Choosing comps will be more difficult: One of the struggles in today’s market is comps are sparse. Think about it this way. Locally we had about 11,000 fewer sales last year from the pre-2020 normal (that’s about 40% fewer). This effectively means there were 11,000 fewer comps available. Yikes. That certainly makes it much more challenging to value properties.
Lifestyle buyers and sellers will be on the move: Just like last year, we’ll see lifestyle buyers and sellers on the move. Divorce, death, moving up, moving down, retiring, buying a first home, moving out of state, relocating, investing, etc… In 2023, the local market saw nearly 40% fewer buyers from the pre-2020 normal, which is sobering. However, I want to emphasize that 60% of the market happened. My sense is sometimes people talk about there being 0% housing demand, but that’s fiction. Yet, let’s not gloss over 40%. Imagine taking a 40% cut in pay or losing 40% of your body weight. This is a glaring number.

A market where expertise is required: Everyone feels like an expert when things are good, but true expertise shows up when things aren’t so good. As we look to 2024, it’s going to be an opportunity to flex market knowledge, find creative ways to get deals done, and stand out as an expert. My advice? Cut through the noise, focus on the part of the market that is happening, and be a resource for consumers. If it helps, I pushed out a free spreadsheet to make neighborhood graphs.
Some people are maybe too certain about the future: Here’s a meme I pushed out yesterday, and this says it all. “Bro, I know I didn’t get it right last year, but this year I’m right.” That’s the sentiment with rates and other predictions, and I think overall many people are feeling pretty confident about predicting the future of the housing market right now. Frankly, the start of 2024 reminds me of last year where there was so much optimism and hope since rates were going to go down… Look, there is nothing wrong with talking about the future, and there’s certainly nothing wrong with an optimistic view in life. I just think things get iffy when people start promising the trend and speaking in such definitive terms about what is going to happen. My advice? Be realistic about the market, form ideas based on data, talk about future possibilities, cultivate optimism in life, and be careful about letting hope for change cloud your perception of the housing market.

Realizing we’re in this for longer: Sellers sitting out of the market is not a temporary thing for just a year. This is going to be a longer process, and 2024 is likely going to reinforce that. The truth is we have a new normal in housing right now where volume numbers just aren’t going to be what they were. The thing is we don’t know exactly how long this will last because we are in the mist of the trend. It’s going to take time to understand all of this. For now, we are in a season where supply is poised to be subdued until there is more affordability or a mechanism to cause owners to sell.
Doing to Gen Z what was done to Millennials: I saw a headline the other day from Fox Business about Gen Z wanting to rent instead of buy, and it reminded me of the narrative regarding Millennials. For so many years people talked down about Millennials saying stuff like, “They only want to eat avocado toast instead of buy a house.” Yet, Millennials are currently the largest generation buying homes today, so that narrative didn’t pan out. In short, I don’t buy the notion that Gen Z doesn’t want homes either. Granted, affordability is a massive issue, but affording a home is something far different than wanting to own a home. I think some of this narrative springs from a generational pecking order where it’s common to speak down about whoever is coming next. You know, let’s not do that. We can do better.

Blaming big investors: It’s en vogue to blame institutional investors for the housing crisis we have right now. I’m not saying we shouldn’t talk about investors or give them a pass. I’m just saying they are an easy target, and sometimes a laser focus from legislators on Wall Street investors can distract from focusing on other issues like creating more housing supply and promoting affordability. This year I expect more conversation about this, and I know it’s a huge issue since the map I created showing what Invitation Homes owns in California has been viewed nearly 70,000 times in the past two weeks. By the way, here’s a one-hour segment I did with KQED on the subject.
 The color of the year: Pantone‘s color of the year for 2024 is called Peach Fuzz. Okay, I don’t think Pantone colors shape design for the housing market, but the idea of more color is welcome after years of intoxication with gray. I’ve heard a few people say Peach Fuzz has 90s vibes, which is interesting since 90s fashion is in style right now (you know this if you have teenagers). Anyway, what are you seeing in new construction lately? More color? Less color?
Credibility will be won and lost: Some real estate professionals are going to gain credibility and others will lose it this year. Some folks are going to get caught making predictions that don’t come true, and it’s going to be a bad look.
More conversations about zoning: In various states we are seeing conversations emerge about zoning reform and increasing the number of units allowed on each parcel. In California we’ve seen SB9, and this year we have a new law giving space for a single family home and ADU to become a condo so the ADU can be sold separately. All I’m saying is there is some creativity brewing, and zoning is a really big topic that can affect change. There will be some real estate professionals and tech companies who study this, understand it, and make money off the change too.

Not so easy to be a real estate professional: 2023 was a brutal year for real estate professionals since volume was so low. The truth is volume pays the bills – not higher prices. Anyway, if volume improves this year, that will help somewhat, but volume is still poised to be lower unless we see a sharper improvement to affordability, so I would say to expect to work harder, get creative about finding deals, stay in front of people, make it all about building relationships, share your knowledge, and build a bigger network. Gone are the days of 2021 where things came easy.
Taking mental health seriously: I want to end on this, which is something I shared last year in my housing outlook. I think some people this year are going to need to opt out of real estate conversations for the sake of mental health. If you’re feeling depressed after reading articles or social media housing posts, maybe it’s time to distance yourself, do some inner work, or unsubscribe (even from my blog). My advice? Take your mental health seriously by cultivating contentment regardless of what the housing market is doing. If you’re only happy if the market is up too, that’s something to put in your pipe and smoke (figure out). I find it’s hard today to stay grounded in today’s world with so much sensationalism and such a lopsided focus on what the future holds. The wild part is mostly everyone is wrong about their predictions, so there is so much worry wasted on stuff that often doesn’t pan out (think Y2K). The sobering part is people are losing joy today because of what the future may or may not bring. Moreover, if you’re listening to voices promoting real estate doomerism, maybe it’s time to step back and assess the credibility and intent of that message. If it’s one thing after another that’s going to potentially crash the market, maybe there is an agenda and you are the target. I know this sounds silly to some for me to mention, but this is real stuff. It’s easy to get entrenched into incessant negativity or fear of the future, but that’s just not healthy. Friends, let’s keep our eyes and minds open, but please be intentional about taking care of yourself. Nobody else can do that for you.
Thanks for being here.
Questions: What do you think is going to happen this year? What stood out to you most above? What do you agree or disagree with?
If you liked this post, subscribe by email (or RSS). Thanks for being here.


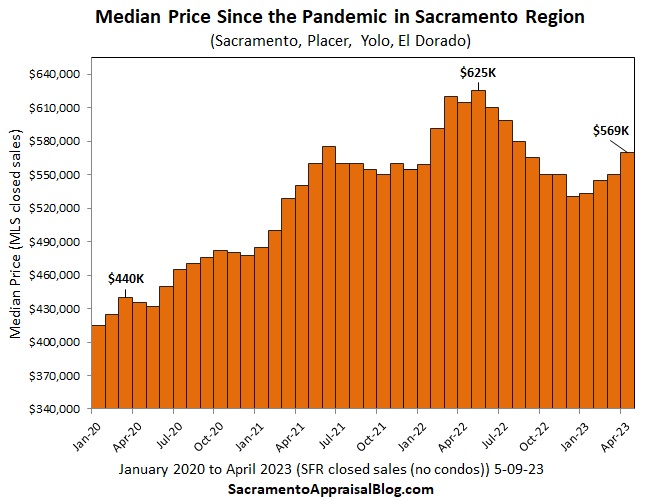
 The spring started out more subdued, but it’s really become competitive. When looking at median price change from January to April, we’ve seen about 7% growth so far in the region. This is pretty decent for the time of year (slightly lower than normal). Based on what I’m seeing in the pendings, we should see some standard if not strong growth ahead in May closed sales. Keep in mind this does NOT mean prices are up 7% for every property. Please look to the comps. The median price does NOT translate rigidly to every parcel or area.