• Skip to primary navigation
  • Skip to main content
  • Skip to primary sidebar

Sacramento Appraisal Blog | Real Estate Appraiser

Real estate appraisals for divorce, estate settlement, loans, property tax appeal, pre-listing and more. We cover Sacramento, Placer and Yolo County. We're professional, courteous and timely.

  • About
  • Appraisals
  • Order
  • Ask Ryan
  • Areas
  • Classes
  • Press
  • Trends
  • Share
  • Contact

real estate stats

What is your housing persona?

February 16, 2021 By Ryan Lundquist 23 Comments

The market is going to implode. No, it’s actually all good. There are so many opinions right now. Take a look at the housing personas and let me know which one(s) you’ve seen. Then I have a big market update for those interested.

WHAT IS YOUR HOUSING PERSONA?

Doomsday Daniel: The market is going to crash like it did years ago.

Worried Will: Not making any decisions because he’s so worried.

Zoe Zillow: Totally obsessed with Zillow.

Pedro Prophet: Makes new predictions when old ones don’t come true.

Bubble Betty: This is definitely another housing bubble.

Fine Fiona: The market is fine. There are no worries.

Waffling Wally: Sorta kinda 50/50 about the market.

Headline Harlow: This person says whatever the latest headlines say.

Foreclosure Frances: Another foreclosure wave is coming. Just wait.

Polly Pollyanna: It’s all good and it’s always a good time to buy and sell.

Uncertain Ursula: Honestly not sure what to make of this current market.

Bloodthirsty Benjamin: Cannot wait for a crash to buy investments.

Withdrawn Wionna: Stepped aside because she cannot afford the market.

Forbearance Felix: All housing conversations lead back to forbearance.

Spencer Spinster: Negative housing aspects are spun into something positive.

Rosy Rosario: Sees everything through a rose-colored lens.

Equity Ernesto: Has huge equity to deploy to a different neighborhood.

Discouraged Dominic: Has struggled to get an offer accepted.

Eva Exodus: Close to moving to Idaho. Or South Carolina. Or Texas.

Sell Soon Stanley: Getting ready to list because the top is near.

Normal Norman: The market is normal and not in a “bubble”.

FOMO Finnegan: He’s jumping in because he’s afraid of missing out.

Sariyah Stats: Has stats and numbers to quote. Always.

Bentley Buzzword: The market is headed toward a “shift” in the future.

Cyclepants Chloe: The market has a 7 year cycle and time is up.

Laid-back Lexi: Not stressed about housing. Always chill.

Carson Corrector: Prices will correct but not implode.  

Walter One Metric: The market will turn as soon as this one thing happens.

Bailey Broken Crystal Ball: Nobody knows the future.

This is all in good fun. I hope you enjoyed this. What other names would you suggest? Did I miss anything?

———————- (skim or digest slowly) ———————–

BIG MARKET UPDATE

For those interested, here’s a big Sacramento market update:

THE SHORT VERSION:

Here is a highlight reel to talk through some of the bigger themes right now. In short, the stats are stunning and this is likely the most competitive market we’ve ever had. Demand is simply excessive while supply is anemic.

QUICK RECAPS:

I’m thinking about doing these charts every month. Do you like them?

NOTE: I’m not going to do Yolo or El Dorado County charts because there aren’t enough sales. Stats would be ALL over the place year over year.

THE LONGER VERSION (organized by county):

1) Sacramento Region
2) Sacramento County
3) Placer County
4) El Dorado County

I welcome you to share some of these images on your social or in a newsletter. Please use this stuff. In case it helps, here are 5 ways to share my content (not copy verbatim). Thanks.

1) SACRAMENTO REGION:

    2) SACRAMENTO COUNTY:

3) PLACER COUNTY:

4) EL DORADO COUNTY:

Other visuals: Not that you needed more, but check out my social media in coming days and weeks for extra visuals. I am posting daily stuff on Facebook, Twitter, and LinkedIn. Oh, and sometimes Instagram.

Thanks for being here.

Questions: Which housing persona(s) have you seen? What stands out to you about the market lately? I’d love to hear your take.

If you liked this post, subscribe by email (or RSS). Thanks for being here.

Share:

  • Click to share on Twitter (Opens in new window)
  • Click to share on Facebook (Opens in new window)
  • Click to share on LinkedIn (Opens in new window)

Filed Under: Market Trends Tagged With: 2021 housing market, 2021 housing stats, Appraisal, Appraiser, El Dorado County, housing predictions, January 2021 housing market, market recap, personas, Placer County, real estate stats, Sacramento County, sacramento region housing market

Peak prices & “bubble” conversations

June 14, 2018 By Ryan Lundquist 14 Comments

We’re about to have more real estate “bubble” conversations. Why? Because prices are very close to where they were at the previous peak of the market. Here’s a few things that come to mind when these conversations come up. Then for those interested I have a big monthly market update. Anything to add?

Higher prices fuel conversation: As prices rise, it inflames conversation about a real estate “bubble”. Media outlets cover this topic of course, but it’s also on the mind of the public.

Stats are VERY close to the peak: Markets throughout the country are different, but in Sacramento most price metrics are getting very close to the peak from 2005. In fact, the average sales price in the Sacramento region is now the SAME as it was back then.

No formula: As a friendly reminder, there is no “bubble” formula that says the market will plummet if we get back to prices from 10+ years ago.

Hello inventory: As news of high prices gets out there, some sellers will put their homes on the market thinking we are at the top. So let’s watch inventory very closely in coming time.

Normal seasonal slowing: Right now the market is slowing, and some are saying, “It’s starting to turn. Pop. The Bubble is happening!!!” Here’s the thing though. Markets tend to have a seasonal cycle where things are hot and then they cool off. When the market begins to soften each year we tend to hear a little more doom & gloom because sometimes we confuse a seasonal slowing with the market tanking. At the moment the stats in Sacramento look normal for the season and don’t indicate the market has made a big turn down, so I’ll keep saying that unless I have a reason not to. Make sense?

Less room: There is less room for prices to increase unless the job market and wage growth really start to move. So it seems logical for the market to slow down. Yet there are many dynamics that make prices move, and nobody has a crystal ball to say exactly what prices will do in the future.

Don’t forget Inflation: This might sound anal, but let’s get technical about comparing older prices with today’s prices. We’ve had thirteen years of inflation since 2005, and that means it’s gotten more expensive to buy the same goods today than it was in the past. For instance, the peak of the market in Sacramento saw a median price at $395,000 in 2005, but when adjusting that figure for inflation with an inflation calculator, a price at $395,000 in 2005 would technically have the same purchasing power of $511,000 today. So as today’s median price approaches $395,000, we have to realize it’s really not the same $395,000 as it was in 2005 because of how the value of the dollar has changed over time.

But the market doesn’t care about inflation: Okay, let me now throw a curveball. It’s important to understand how inflation works for the sake of comparing older stats, but I don’t think most buyers and sellers actually care about inflation. They don’t say, “Sweet, prices today look like they’re the same as 2005, but technically they’re lower because of inflation.” No, people tend to see prices and say, “Holy heck, we’re back to the peak.” I’m not dismissing the need to understand how inflation works, but only being real about how the bulk of buyers and sellers tend to think. Besides, it doesn’t matter how close we are to the previous peak anyway because there is no formula that says the market will “pop” at that level.

Preaching doom: Some preach doom & gloom, and that’s fine. My advice though? Be realistic about your ability to predict the future. Some have been making annual real estate predictions about how the market is about to collapse, and I’m hearing many say the big change is now coming later this year or in 2019. The problem is when these predictions don’t come true the “prophecies” simply get pushed back another year. The irony is if a person keeps making the same prediction every year, at some point that person could be right.

Seeing only red flags: It’s getting less affordable. The economy isn’t that great. Interest rates are rising. Home prices have outpaced wage growth. Lenders are getting more creative with financing. These are red flags for sure. But let’s remember just because unhealthy elements exist in a market does not mean it’s starting to crash. My advice? Be honest about the red flags, but let actual stats inform what you say and think about the market. Keep in mind many articles in coming time are going to preach doom, but take a step back from the articles and look to the stats. What do the stats say? And what is the mood among buyers and sellers in the market? That’s the only thing that matters. 

Open letter to worried buyers: Last year I wrote an open letter to buyers worried about another housing bubble. I have some practical advice and tips in there in case it’s relevant.

I hope that was interesting or helpful. Anything to add?

-—-—- Big monthly market update (long on purpose) ———–

We saw what we would expect to see last month. It felt like a normal May. Well, actually it was the strongest May of sales volume since 2013. Prices ticked up again, it took three less days to sell, and inventory remained sparse. Overall the stats are glowing, but it’s important to recognize the market is starting to slow for the season. We are seeing way more listings hitting the market, and this is transferring some power from sellers to buyers. We are also seeing more price reductions. In a few months we will likely see this slowness in the stats, but for now check out some glowing numbers below.

The previous “bubble” vs now:

1) Housing inventory: Since late last year housing inventory has begun to increase subtly. Right now we have 1.5 months of housing supply whereas one year ago we had 1.26 months of supply. Some might interpret this to mean the market has begun to collapse and really change directions, but this is still a very anemic level of housing supply, and the market has been able to handle this change easily because of strong demand. For reference, when the market collapsed in 2005 inventory literally doubled in 90 days from the summer to the fall. That’s a far different story than what we’ve seen so far this year with a minor uptick in inventory over the past two quarters. 

2) Sales volume: If we did have a “bubble” and it burst, I would expect to see more listings hit the market and most likely a drop in sales volume. In 2005 the market changed and properties simply stopped selling as you can see below. In one year sales volume literally dropped by 43%. Yikes!! In contrast, right now sales volume has been very steady. Let’s keep an eye on sales volume and inventory though because both metrics might help us gauge if the market really is changing. Remember though, before we see a change in sales, we’ll hear of a change in the mood of buyers and sellers. Thus the trend always happens in the listings first before we start to see it in the sales. That’s why the word on the street is so important in real estate (agents, please keep emailing me to let me know what you are seeing out there).

I could write more, but let’s get visual instead.

DOWNLOAD 61 graphs HERE: Please download all graphs here as a zip file. See my sharing policy for 5 ways to share (please don’t copy verbatim).

SACRAMENTO COUNTY (more graphs here):

SACRAMENTO REGION (more graphs here):

PLACER COUNTY (more graphs here):

DOWNLOAD 61 graphs HERE: Please download all graphs here as a zip file. See my sharing policy for 5 ways to share (please don’t copy verbatim).

Questions: What are you hearing buyers and sellers saying about the market? Do you think the market has turned or are we seeing a seasonal slowness? I’d love to hear your take.

If you liked this post, subscribe by email (or RSS). Thanks for being here.

Share:

  • Click to share on Twitter (Opens in new window)
  • Click to share on Facebook (Opens in new window)
  • Click to share on LinkedIn (Opens in new window)

Filed Under: Market Trends Tagged With: adjusting for inflation in real estate, bubble conversations, comparing then vs now, El Dorado County, home appaiser, House Appraiser, inflation calculator, Placer County, real estate bubble, real estate stats, Sacramento County, Sacramento Region

A slowing market & value by Starbucks cups

October 11, 2017 By Ryan Lundquist 8 Comments

Imagine not being able to see home prices. How would we measure value? In other words, could we determine higher values in one area compared to another based on things like school ratings, owner occupancy rates, or the income of residents? Let’s consider that, talk about the market in terms of Starbucks cups, and then dig deep into Sacramento trends for those interested. Any thoughts?

If we couldn’t see prices, what would be the best indicator of value?

1) Income of residents.
2) School ratings.
3) Percentage of owner occupied units.
4) Crime rates.
5) Length of grass.
6) Walking score.
7) Proximity to Downtown.
8) Proximity to coffee shops.
9) Number of cats in the neighborhood (thanks Gary).
10) What else?

The Takeaway: If we didn’t have access to prices in an area we could probably analyze some of the list above to get a sense of higher or lower values in certain areas. Ultimately we have to remember value is about the stuff behind the price, so it’s key to be in tune with what’s making value move in various places.

Here is a Twitter poll I ran:

Starbucks cups instead of price: Keeping with the theme, let’s talk about the market in terms of the cost of Starbucks cups (tall size) instead of price.

Real stats in the Sacramento region (but with coffee):

1) The median price softened by 2,512 cups of Starbucks coffee last month.
2) Since summer the median price has softened by 5,128 cups of coffee.
3) The median price will likely decline by 10,000 cups of coffee this fall.
4) The median price is up 15,384 coffee cups compared to last year.

Okay, don’t take me too seriously on this. But isn’t it interesting to think about value beyond just price? Next week: Avocado toast price metrics… (kidding).

I hope that was interesting. Anything to add?

–——-——- Big monthly market update (it’s long on purpose) ———–——-

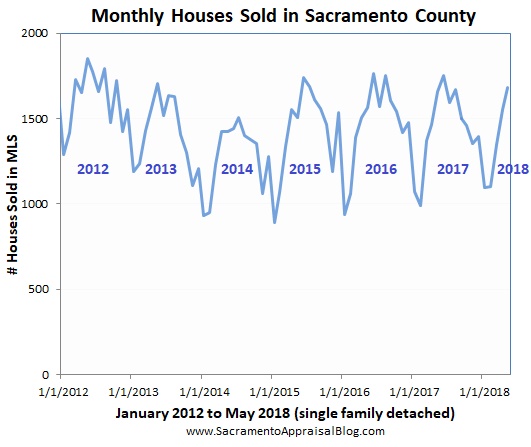
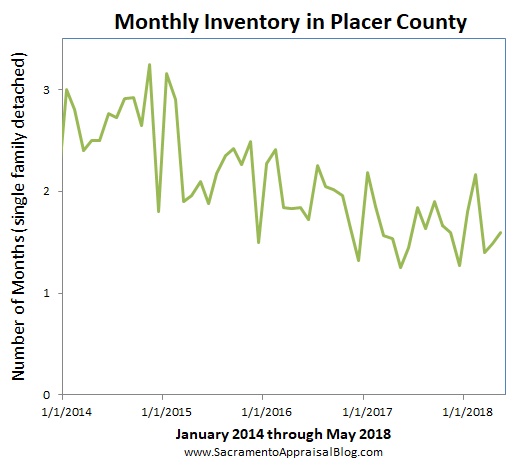
We’re at that time of year. Sales volume has likely peaked for the season. The median price probably climaxed in the summer. Housing inventory is increasing, and each month it’s taking longer to sell in Sacramento. Overall the market has a slower feel compared to a few months ago, values have begun to soften in many areas, and even rents have been flat for a few months according to Yardi Matrix. We’re seeing a seasonal softening in county-wide stats (especially regional stats), but we’re also observing slowness in many neighborhoods as homes are tending to have less offers, less traffic, and even sell for slightly less than the highest prices from a few months back. News like this sometimes freaks people out because they think the market is tanking, but like clockwork the market almost always softens during the fall.

A huge stat to know: Every year the median price and average sales price in Sacramento County tend to soften by about 5%. This doesn’t necessarily mean values decline by 5% in every neighborhood or price range, but it does mean we can expect price softening in most areas during the fall season.

A word to sellers: Don’t be that stereotypical person who doesn’t listen to the market when it comes to price. Right now the market is slowing and the number of price reductions is higher than it’s been all year. As long as you’re priced reasonably you’re going to get offers, but be cautious not to price unrealistically high because you’re hearing the market is blazing “hot”.

I could go on, but let’s get visual.

DOWNLOAD 73 graphs HERE: Please download all graphs in this post and more here as a zip file (includes a stat sheet too). See my sharing policy for 5 ways to share (please don’t copy verbatim).

SACRAMENTO COUNTY (more graphs & stats here):

SACRAMENTO COUNTY STATS:

  1. The median price is currently $347,500 and dipped 0.1% last month.
  2. The median price is 9.6% higher than the same time last year.
  3. Sales volume in September was 6.8% lower this year than 2016. There were 1499 single family detached sales last month.
  4. It took an average of 26 days to sell a home last month (one year ago it was taking 4 days longer).
  5. The median days on market last month was 14 days.
  6. It took 2 more days to sell in September compared to August (median days).
  7. FHA sales were 19.4% of all sales last month in the county.
  8. Only 1% of sales last month were bank-owned & 1.1% were short sales.
  9. The avg price per sq ft was about $223, which is slightly higher than last month (11% higher than last year).
  10. The avg sales price increased about 1.3% last month and is currently $384,000. This is 10.9% higher than last year.
  11. Cash sales were 13% of all sales last month.

SACRAMENTO REGION (more graphs & stats here):

SACRAMENTO REGION STATS:

  1. The median price is $385,000 and declined about 1% last month.
  2. The median price is 8.4% higher than the same time last year.
  3. Sales volume in September was 3.6% lower this year than 2016. There were 2422 single family detached sales last month.
  4. It took an average of 31 days to sell a home last month (one year ago it was taking 4 days longer).
  5. The median days on market last month was 15 days, which means properties are selling really quickly.
  6. The median days on market increased by 2 days last month, which helps shows a slowing in the market.  
  7. FHA sales were 16.1% of all sales last month.
  8. Only 1.1% of sales last month were bank-owned & 0.8% were short sales.
  9. The avg price per sq ft was about $228, which increased about 1% last month (10% higher than last year).
  10. The avg sales price declined about 1% last month and is currently $425,516. This is 8.3% higher than last year.
  11. Cash sales were 14.9% of all sales last month.

PLACER COUNTY (more graphs & stats here):

PLACER COUNTY STATS:

  1. The median price is currently $450,000 and declined about 3% last month.
  2. The median price is 4% higher than the same time last year.
  3. Sales volume in September was 1.3% less this year than 2016. There were 524 single family detached sales.
  4. It took an average of 34 days to sell a home last month (one year ago it was taking 7 days longer).
  5. The median days on market last month was 18 days, which means properties are selling really quickly.
  6. The median days on market increased by 3 days last month, which helps shows a slowing in the market. 
  7. FHA sales were 12.9% of all sales.
  8. There were only 3 bank-owned sales last month and only 2 short sales.
  9. The avg price per sq ft was $231, which is slightly higher than last month (9.1% higher than last year).
  10. The avg sales price decreased about 3.5% last month and is currently $490,615. This is 1.6% higher than last year.
  11. Cash sales were 17.1% of all sales last month.

DOWNLOAD 73 graphs HERE: Please download all graphs in this post and more here as a zip file (includes a stat sheet too). See my sharing policy for 5 ways to share (please don’t copy verbatim).

Questions: Besides price, what do you think the strongest indicator of value is for a neighborhood? Anything else you’re seeing in the market? Should we start a Starbucks Cups Price Index maybe? I’d love to hear your take.

If you liked this post, subscribe by email (or RSS). Thanks for being here.

Share:

  • Click to share on Twitter (Opens in new window)
  • Click to share on Facebook (Opens in new window)
  • Click to share on LinkedIn (Opens in new window)

Filed Under: Market Trends Tagged With: home appraisals, house appraisals, lower values, Placer County, Real Estate Appraisals, real estate appraisers, real estate stats, Sacramento real estate trends, sacramento regional housing market, softening values, Starbucks, trend graphs for sacramento

The myth of the collapsing market (and a big Sacramento market update)

September 13, 2017 By Ryan Lundquist 4 Comments

Positive real estate news is sexy. It gets clicks. It makes us feel good. And we love sharing it. But what happens when the market cools? Well, it’s not always easy to digest. In fact, lots of people freak out and think the market is starting to tank when it’s actually just doing its normal thing of slowing. Today let’s talk about the danger of embracing the collapsing market myth, and then take a deep look at the slowing Sacramento market. Any thoughts?

The myth of the collapsing market: The market tends to slow down around this time of year. Just as the weather changes, so does the real estate market. The kids go back to school, sales volume usually starts to slide, inventory goes up, and prices soften. Yet despite this happening nearly every single year, we hear things like, “The market is beginning to take a big turn” or “The ‘bubble’ has finally popped.” Case-in-point, I watched a video a few weeks back from a national show that said new construction home prices in Texas were beginning to take a turn, and that the Texas market was six months ahead of everyone else. Maybe this show is correct, but my problem is the host made a huge sweeping market statement based on a VERY minor dip in prices from June to July. I suppose I could do the same in Sacramento since the median price dipped 1% last month. The truth is we’ll see many more articles like this in coming months because we tend to confuse a seasonal softening with a big market turn. It’s like we forget the market is cyclical at this time of year.

My advice? Cut through the hype and know the seasonal market wherever you are located in the United States. What does the market normally do at this time of year? What normally happens to prices, sales volume, and inventory? Understanding what a slowing season tends to look like can help us give advice to friends and clients, and we can avoid saying the market is tanking just because prices dipped last month. Of course at some point the market really could collapse, but unless we are seeing symptoms beyond a normal seasonal slowing, it’s probably okay to be cautious of a doom & gloom housing message.

I hope that was helpful or interesting. Any thoughts?

–——-——- Big monthly market update (it’s long on purpose) ———–——-

The stats have been glowing for months in Sacramento County, but last month we finally saw a dip in prices. In short, the glowing stats are now showing a slowing. But that’s not really a surprise because we all felt this slowing in the market for the past 30-60 days. It’s just we didn’t see it show up in the sales stats until now. After all, it takes a month or two to see slower pendings close escrow. Anyway, the median price dipped by about 1%, inventory increased, and most importantly it took 3 days longer to sell last month than the previous month. I know, there are still multiple offers and there is still upward pressure in some areas and price ranges. I get that. Remember, the market is slowing, but that does not mean it is dull or slow. Ultimately when looking at price metrics, the market is up anywhere from 7-9% from last year, and sales volume is about the same as last year too, which shows the market is trying to normalize. Housing inventory in the region is about 10% lower than it was last year at the same time, which reminds us that the market is still more aggressive compared to last year. Lastly, if the market was collapsing, I’d suspect we would be seeing a big change in the psyche of buyers, a big change in inventory, and a big change in sales volume. Not that the market has to tank the same way all the time, but if values were turning we’d likely expect to see something much more out-of-the-ordinary beyond all the normal seasonal stuff we’re seeing right now.

DOWNLOAD 66 graphs HERE: Please download all graphs in this post and more here as a zip file (includes a stat sheet too). See my sharing policy for 5 ways to share (please don’t copy verbatim).

SACRAMENTO COUNTY (more graphs & stats here):

SACRAMENTO COUNTY STATS:

  1. The median price is currently $348,000 and dipped 1% last month.
  2. The median price is 7.6% higher than the same time last year.
  3. Sales volume in August was 4.7% lower this year than 2016. There were 1668 single family detached sales last month.
  4. It took an average of 24 days to sell a home last month (one year ago it was taking 2 days longer).
  5. The median days on market last month was 12 days, which means properties are selling quickly.
  6. It took 3 more days to sell in August compared to July (median days).
  7. FHA sales were 22.6% of all sales last month in the county.
  8. Only 0.8% of sales last month were bank-owned & 1.5% were short sales.
  9. The avg price per sq ft was about $223, which is slightly higher than last month (8.7% higher than last year).
  10. The avg sales price decreased about 1.5% last month and is currently $378,885. This is 6.8% higher than last year.
  11. Cash sales were 12.5% of all sales last month.

SACRAMENTO REGION (more graphs & stats here):

SACRAMENTO REGION STATS:

  1. The median price is $389,900 and declined slightly last month.
  2. The median price is 9% higher than the same time last year.
  3. Sales volume in August was 0.2% higher this year than 2016. There were 2771 single family detached sales last month.
  4. It took an average of 28 days to sell a home last month (one year ago it was taking 3 days longer).
  5. The median days on market last month was 13 days, which means properties are selling really quickly.
  6. The median days on market increased by 2 days last month, which helps shows a slowing in the market.  
  7. FHA sales were 18.1% of all sales last month.
  8. Only 0.8% of sales last month were bank-owned & 1.48% were short sales.
  9. The avg price per sq ft was about $227, which is the same as last month (7.9% higher than last year).
  10. The avg sales price declined slightly last month and is currently $430,101. This is 8.6% higher than last year.
  11. Cash sales were 14% of all sales last month.

PLACER COUNTY (more graphs & stats here):


PLACER COUNTY STATS:

  1. The median price is currently $462,000 and increased about 2% last month (but still down from a couple months ago).
  2. The median price is 7.4% higher than the same time last year.
  3. Sales volume in August was 14% higher this year than 2016. There were 637 single family detached sales.
  4. It took an average of 30 days to sell a home last month (one year ago it was taking 10 days longer).
  5. The median days on market last month was 15 days, which means properties are selling really quickly.
  6. The median days on market increased by 3 days last month, which helps shows a slowing in the market. 
  7. FHA sales were 12.5% of all sales.
  8. There were only 2 bank-owned sales last month and only 9 short sales.
  9. The avg price per sq ft was $229, which is slightly higher than last month (7.4% higher than last year).
  10. The avg sales price increased about 0.5% last month and is currently $508.686. This is 7.7% higher than last year.
  11. Cash sales were 14.4% of all sales last month.

DOWNLOAD 66 graphs HERE: Please download all graphs in this post and more here as a zip file (includes a stat sheet too). See my sharing policy for 5 ways to share (please don’t copy verbatim).

Questions: What are you seeing out there? What signs of slowing have you noticed? Did I miss anything? I’d love to hear your take.

If you liked this post, subscribe by email (or RSS). Thanks for being here.

Share:

  • Click to share on Twitter (Opens in new window)
  • Click to share on Facebook (Opens in new window)
  • Click to share on LinkedIn (Opens in new window)

Filed Under: Market Trends Tagged With: appraiser in Sacramento, competitive market, Home Appraiser, house appraisers, low inventory, Placer County real estate, prices softening, real estate graphs, real estate stats, Sacramento County Real Estate, sacramento regional housing market, slowing market, slowing real estate market, trend graphs

  • Go to page 1
  • Go to page 2
  • Go to Next Page »

Primary Sidebar

Connect with Ryan

 Facebook Twitter LinkedIn YouTube Instagram

Subscribe to Weekly Post

* indicates required

Search this site

Blog Categories

  • Appraisal Stuff (407)
  • Bankruptcy (3)
  • Divorce (4)
  • Estate Settlement (6)
  • FHA Appraisal Articles (56)
  • Internet (53)
  • Market Trends (482)
  • Photos from the Field (126)
  • Property Taxes (70)
  • Random Stuff (231)
  • Resources (566)
  • Videos (161)

Blog Archives: 2009 – 2021

Lundquist Appraisal Links

  • Appraisal Order Form
  • Appraisal Website
  • Rancho Cordova Appraiser Website
  • Sacramento Appraisal Blog Sitemap
  • Sacramento Real Estate Appraiser Facebook Page
  • Twitter: Sacramento Appraiser (@SacAppraiser)
  • YouTube: Sacramento Appraiser Channel

Most Recent Posts

  • How much have prices risen since 2012?
  • How long can this market keep going?
  • What is your housing persona?
  • Rapid price growth & the Gilmore Girls next door
  • Are first-time buyers targeting 2-4 unit properties?
  • Stale real estate headlines & buyers flocking to El Dorado County
  • My new sewer line adds huge value, right?
  • The housing market nobody predicted
  • Real estate trends to watch in 2021
  • You carried me & a spreadsheet for Christmas

Disclaimer

First off, thank you for being here. Now let's get into the fine print. The material and information contained on this website is the copyrighted property of Ryan Lundquist and Lundquist Appraisal Company. Content on this website may not be reproduced or republished without prior written permission from Ryan Lundquist.

Please see my Sharing Policy on the navigation bar if you are interested in sharing portions of any content on this blog.

The information on this website is meant entirely for educational purposes and is not intended in any way to support an opinion of value for your appraisal needs or any sort of value conclusion for a loan, litigation, tax appeal or any other potential real estate or non-real estate purpose. The material found on this website is meant for casual reading only and is not intended for use in a court of law or any other legal use. Ryan will not appear in court in any capacity based on any information posted here. For more detailed market analysis to be used for an appraisal report or any appraisal-related purpose or valuation consulting, please contact Ryan at 916-595-3735 for more information.

There are no affiliate links on this blog, but there are three advertisements. Please do your homework before doing business with any advertisers as advertisements are not affiliated with this blog in any way. Two ads are located on the sidebar and one is at the bottom of each post. The ads earn a minor amount of revenue and are a simple reward for providing consistent original content to readers. If you think the ads interfere with your blog experience or the integrity of the blog somehow, let me know. I'm always open to feedback. Thank you again for being here.

Copyright © 2021 Sacramento Appraisal Blog