If the median price goes up by 2% in one month in a zip code, does that mean you have 2% more value for your property? Should you add that 2% to a new listing or appraisal? Or since the median price rose by 75% from early 2012 in Sacramento County, does that mean you have 75% more value? Not necessarily.
NOTE: Understanding how the median price works is important for valuing properties and communicating with clients.

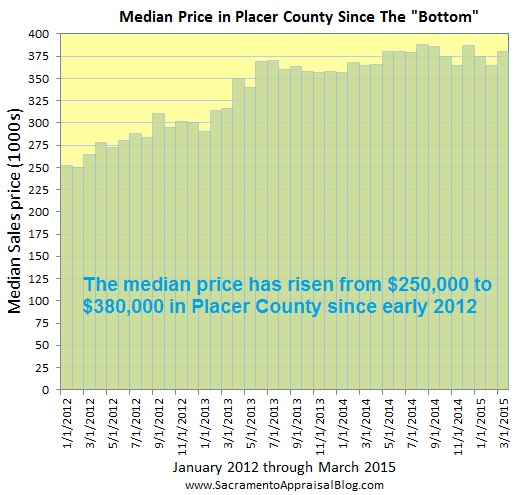
What is the median price? If you lined up all sales in a county or zip code from lowest to highest price, the median price would be the sale in the middle. Over time this figure can help us see how a market is moving, but applying median price increases from a zip code to a particular home can get us into quick trouble.
5 reasons why median price increases don’t translate to actual dollar for dollar increases:
 Sales Volume: The monthly median price is based on how many sales there were in a given month. If there are few sales in a market, the median price could see a huge swing, which means it can go up and down very quickly (which means we should be very careful about applying the increase or decrease to our property’s valuation).
- Less junk sales at the bottom: In 2012 and 2013 cash investors gutted the distressed market (low-priced short sales and foreclosures), and then flipped many of these low sales at higher levels. This essentially means the bottom of the market was removed. Now imagine the median price again, which is the sale in the middle of all sales if you lined them up by price. All of the sudden the sale in the middle got much higher because the bottom distressed part of the market was removed in a short period of time. Thus the market on paper shows very significant median price increases, but that’s really because of the bottom disappearing, right?
- Seasonal Moods: The median price tends to see a huge uptick during the early Spring.. For instance, imagine the median price increased by $25,000 from January to March. Does this mean values increased by $25,000? Not necessarily. It’s just the stale sales from Fall were much lower in price, and now current values are in high gear for the Spring (which is normal for Spring). Sometimes values in the beginning of the Spring are aggressive and they seem incredibly high, but in reality they might be picking up where the market left off at the end of Summer (or maybe slightly above). This is why we need to look at sales well beyond just the past 90 days.
- Larger Homes: Imagine there were larger-sized homes that sold last month compared to the previous month. We might look at the median price and say, “Wow, look how much the market increased last month”, but in reality there were simply bigger homes that sold at higher levels that made the median price increase.
- Zip Code vs Neighborhood: Not every neighborhood is experiencing the same trends as the entire zip code, and not every price range behaves the same way either. The zip code might show a 2% monthly increase in median price, but are neighborhood listings being priced higher or lower than recent sales? Are listings spending longer or shorter times on the market? Are sellers getting what they ask for? We have to be sure to take a hyper-local look at sales and listings in the immediate neighborhood before blindly applying zip code trends. The zip code might show a 2% median price increase, but maybe after looking at the numbers in the neighborhood itself, values in the neighborhood increased very modestly by maybe 0.50 to 1.0% in actual value over the month.
I hope this was helpful. As always, thank you sincerely for reading.
Question: Anything else you’d add? I’d love to hear your take.
If you liked this post, subscribe by email (or RSS). Thanks for being here.


The market ripened early this year. Buyers have simply been ready before sellers. On one hand listings and sales have been at fairly normal levels for the first two months of the year, so we can say the market is normal in that regard. But buyer demand really took off last month as pendings in the regional market were up by almost 30% compared to last February. This is the part that is not normal, and why we can say the Spring market ripened early.
One Paragraph to Explain the Market: Well-priced listings are going quickly and experiencing multiple offers, but otherwise properties are sitting on the market if they are not priced correctly. Buyers have been anxious to get into contract, but at the same time they seem to be showing discretion by not readily pulling the trigger on homes with adverse locations or issues. This has led to a sense of many current listings feeling like leftovers since they’ve been well vetted like thrift store clothing. The good news is we are reaching the time of year where more listings should be hitting the market to help alleviate the pressure of a lack of good inventory. Lastly, it took a few less days to sell last month, inventory decreased, and the sales to original list price ratio increased (all normal in Spring).
NOTE: I am posting once a week now, and this means my big monthly post will have less text, but a few more graphs (Placer, Sacramento County, & Regional Market).
Two ways to read this post:
DOWNLOAD 45+ graphs HERE for free (zip file): Please download these 45+ graphs here as a zip file (or send me an email). Use them for study, for your newsletter, or even some on your blog. See my sharing policy for 5 ways to share.
SACRAMENTO COUNTY:
PLACER COUNTY:
SACRAMENTO REGION (Sac, Placer, Yolo, El Dorado):
Questions: What is driving buyers to get into contract? Is it low rates? Is it a sense of needing to get in a home before values rise too quickly? What do you think?
If you liked this post, subscribe by email (or RSS). Thanks for being here.