• Skip to primary navigation
  • Skip to main content
  • Skip to primary sidebar

Sacramento Appraisal Blog | Real Estate Appraiser

Real estate appraisals for divorce, estate settlement, loans, property tax appeal, pre-listing and more. We cover Sacramento, Placer and Yolo County. We're professional, courteous and timely.

  • About
  • Appraisals
  • Order
  • Ask Ryan
  • Areas
  • Classes
  • Press
  • Trends
  • Share
  • Contact

sacramento regional market

The problem of not listening in a slower market

September 12, 2018 By Ryan Lundquist 9 Comments

It’s not easy to listen when the market is slowing. This is true for sellers taking in pricing advice, and it’s also true for the average person reading national headlines. Let’s talk about this. Then for those interested I have a big market update. Anything to add?

Sellers not listening: All year it seems sellers have struggled to listen to pricing advice from their real estate agents. I guess I can understand because they’ve had nothing but “hot” headlines for six years. But I think there’s another issue too. Maybe we’re seeing some of the effect of sellers having more real estate data at their disposal than ever because of Zillow, Redfin, Metrolist, blogs… So right or wrong, we have sellers who now they think they know better than anyone. Whatever the case, sellers are making real mistakes out there by not listening to pricing advice and instead pricing for a much hotter market than we actually have. In case it’s useful, I wrote an article in Comstock’s magazine with some practical advice for sellers.

Listening to national headlines: There have been sensational headlines about the market beginning to crash, and it’s difficult at times to think past these headlines and be objective. Let’s remember though that headlines are designed to get clicks, and a headline may or may not mean anything for a local market. My advice? Don’t let any headline cloud your judgement of local trends.

Listening without enough context: This sounds like such a geeky point, but hang in here with me because it matters. Lots of times in real estate we end up comparing the current year with the previous year, and that’s actually a good thing. But my sense is we’re missing something if we pay too much attention to last year only and ignore prior years. In Sacramento at least it’s been a few seasons since we’ve had a dull fall, so it’s easy to forget what that feels like. Moreover, if we look at current inventory levels beginning to push a two-month housing supply, that looks huge compared to the past couple years. But if we look at inventory from 2014 when we had a dull fall season, it was hovering between 2 to 2.75 months at the time. This reminds us it’s possible to have higher inventory at this time of year without the market utterly tanking. I don’t say this to diminish the importance of rising housing supply right now, but only to highlight the need to look to a few more years of data as we interpret what is happening. After all, sometimes pulling stats is like pulling comps. If we only look at the past 90 days of sales, that might not be enough. At times we need a much wider view to really see the market. The same thing happens with real estate data. Know what I’m saying?

I hope that was helpful. Do you “hear” what I’m saying?

—–——– Big local monthly market update (long on purpose) —–——–

The market has been slowing. Duh, we know that. Everyone’s talking about it. Let me unpack what I mean below with some comments on some of the bigger themes right now:

Coffee vs. skimming: This post has lots of information. It’s designed to skim until you find something you want to read, or pour a cup of coffee and really spend some time digesting stuff.

BIG ISSUES IN SACRAMENTO:

Prices softening: Most price metrics in the region softened between 1-2% last month, though the median price in Sacramento County was flat. Around this time of year we normally see prices dip (as graphs show below).

Slowing momentum: We know the market is slowing for the season, but it’s also slowing down in terms of overall momentum. What I mean is in years past we’d look at stats and see price metrics were up a good 8-10% over the year, but these days they’re only up closer to 4-6% instead.

Slowing rent: Rent growth has been flattening lately, which is a good thing since rents sprinted way ahead of actual wage growth. Keep in mind this doesn’t mean rents have declined. It just seems the rent trend is flattening.

Sales volume is not crashing: One of the bigger issues to watch to know if a market is crashing is a change in sales volume. In other words, if properties stop selling, we have a big problem. Last month sales volume was down about 6% in the region and 2.6% in Sacramento County. Uh oh, is that a warning sign? Look, this is important to watch over time to know if we have a trend on our hands, but before making too much of one month of data, let’s look to the bigger picture. The truth is sales volume is actually higher so far this year in the region than last year and it’s up 1% in Sacramento County too. No mater how we look at it, volume has actually been strong. This isn’t spin, but fact. Please see my charts below. So on one hand let’s watch these next months carefully because it could be a problem if monthly sales volume does start to come in lower, but let’s also not give laser focus to a weaker August while ignoring the bigger context either.

Inventory is definitely up: It’s really noticeable to see more inventory right now. Even my non-real estate wife has said she’s seeing more listings when driving around town. Housing supply is actually up 25% compared to the same time last year, and it’s literally the first time in three years since we’ve had more than a two-month supply of homes for sale. Obviously if the rate of increase keeps climbing and the market doesn’t absorb new listings, we could have a problem on our hands. But let’s also remember when the market was very dull in the fall of 2014 we saw inventory hover between 2 to 2.75 months at the time.

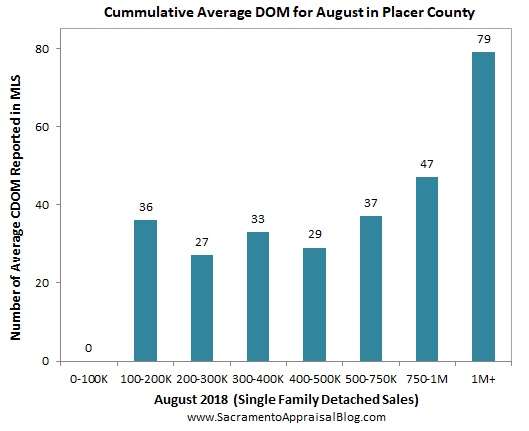
Taking longer to sell: It took five days longer to sell last month compared to the month before. And this year it took 4 day longer than last year at the same time. So the market has slowed down from last year, but it’s definitely slowing from the past few months too. Sellers, did you hear that? You are losing power in this market and buyers are gaining it. My advice? Price according to listings that are actually getting into contract rather than the highest glowing sales from the spring. This week I talked with an agent about the market feeling really soft in a particular area because listings weren’t moving. But sometimes I wonder if it’s the market or just overpriced listings. From my vantage point almost every listing in the neighborhood was priced 5-10%+ too high, so it wasn’t a real shocker they weren’t selling.

I could write more, but let’s get visual instead.

DOWNLOAD 72 graphs HERE: Please download all graphs here as a zip file. See my sharing policy for 5 ways to share (please don’t copy verbatim).

BIG QUESTIONS:

1) How did the market change from last year?

2) How did the market change from July to August?

3) Is sales volume really crashing right now?

4) How does the current market compare to the previous peak?

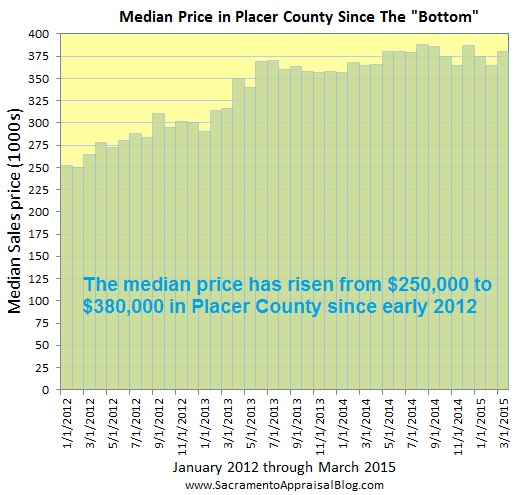
2005 vs CURRENT: A few months ago I talked about peak prices because some metrics were showing 2005 levels. But with the market softening right now prices are growing further apart from the “top” so to speak.

SACRAMENTO COUNTY (more graphs here):

SACRAMENTO REGION (more graphs here):

PLACER COUNTY (more graphs here):

I hope that was helpful.

DOWNLOAD 72 graphs HERE: Please download all graphs here as a zip file. See my sharing policy for 5 ways to share (please don’t copy verbatim).

Questions: Do you think sellers are struggling to listen right now? What are you seeing out there in the market? I’d love to hear your take.

If you liked this post, subscribe by email (or RSS). Thanks for being here.

Share:

  • Click to share on Twitter (Opens in new window)
  • Click to share on Facebook (Opens in new window)
  • Click to share on LinkedIn (Opens in new window)

Filed Under: Market Trends Tagged With: Appraisal, appraisals, appraisers, Housing Bubble, inventory increasing, more listings, peak prices, Real estate agents, sacramento housing blog, Sacramento Market Trends, sacramento regional appraisal blog, sacramento regional market, sales volume, sellers and agents, sellers not listening, softening market, trend graphs, valuations

Stepping on the real estate scale (at the right time of day)

August 15, 2016 By Ryan Lundquist 6 Comments

Values are starting to decline. The market is sliding. Price reductions are increasing. This is exactly what we start to hear around August as the market has transitioned from spring to summer. But is the market really crashing? It could be, but sometimes the issue is simple in that we’re not weighing the market in the right context. Today let’s look at a helpful scale analogy and then unpack the Sacramento market in depth (for those interested). Any thoughts?

42512389 - white scale on a wooden table top view, fitness and weight loss concept

A Scale Analogy: Imagine being on a diet and stepping on a scale in the morning before breakfast and then again at night after eating all day. What would happen? Well, it’s going to look like you gained some weight during the day because the body is light and empty in the morning and naturally heavier at night after a day of eating. Unless you want to punish yourself with thoughts of weight gain, the key for using a scale would be to weigh yourself every day around the same time so you are comparing the same context each day. Otherwise when comparing one context (morning) with a different context (night), it might look like you gained weight when you might have actually lost some.

The Big Point: In real estate we have to consider what it looks like to weigh the market. Often at this time of year we start hearing things like, “Values are starting to tank”, when in reality the market may simply be softening for the season. The problem is we don’t see the softening though because we’re stepping on the scale at the wrong time of day so to speak. For example, if we compare stats from June to July, it looks like the market is declining in value since stats have sagged. Yet if we step back and weigh the market in context by comparing June/July 2016 data vs June/July 2015 data, we see stats also sagged last year. Bingo! This helps us see it’s normal for the market to soften up at this time of year (of course it could be declining, but that’s a different post). In short, if we want to get better at seeing the market it’s critical to compare the latest month of data with the same month last year. Otherwise it’s very easy to start making market claims when the truth is we just might be misreading the trend. If you want to use bigger chunks of data like quarters, that’s fine too. Just compare the past quarter today with the same time period last year. You can also look at many years of data to get an even better sense of seasonal trends.

—-—–—– And here’s my big monthly market update  ———–—–

Big monthly market update post - sacramento appraisal blog - image purchased from 123rfTwo ways to read the BIG POST:

  1. Scan the talking points and graphs quickly.
  2. Grab a cup of coffee and spend time digesting what is here.

DOWNLOAD 62 graphs HERE: Please download all graphs in this post (and more) here as a zip file. Use them for study, for your newsletter, or some on your blog. See my sharing policy for 5 ways to share (please don’t copy verbatim). Thanks.

Slowing Market (Quick Summary): The hot spring season is definitely transitioning to a slower market. What do I mean? It’s taking slightly longer to sell today compared to last month, the median price and average sales price declined from the previous month, inventory saw a 20% increase from June (it’s still really low though), and price reductions have been more common. Yet at the same time the market is actually stronger this year as it was taking 4 days longer to sell last year and price metrics are a good 7-10% higher this year too. Overall the market feels fairly “hot” under $300,000, but there has been notable price resistance at higher price levels. These days well-priced properties are going quickly, but otherwise buyers can smell a high price from a mile away – and they’re not biting. It’s easy to think the market is starting to turn or tank, but it’s normal for the market to soften at this time of year. Unless we begin to see otherwise, right now it looks like we are seeing what seems like the start of a typical seasonal downtrend.

Presidential Election & the Market: We’re hearing lots of talk about how the market is strong because it’s a presidential year, but let’s remember the market is doing what it is doing as a result of years of unfolding trends. The presidential election doesn’t all of a sudden trump (no pun intended) the factors that have been driving the market for years and have caused the market to be where it is today. For context, values in Sacramento were increasing rapidly in 2004, utterly tanking in despair in 2008, recovering in 2012 (due to cash investors and 4% rates), and now the market is figuring out how to be normal after modest value increases this spring. Sure, there could be some impact because it’s a presidential year, but let’s defuse the hype and not overstate it. Take a look at the stats and graphs below and see if you can discern any real difference because this year is a presidential year.

Sacramento County:

  1. The median price is 100% higher than it was in early 2012.
  2. There were only 4 sales under $100K last month (single family detached).
  3. Sales volume has been about the same this year compared to last year.
  4. FHA volume is down about 8% this year compared to 2015.
  5. FHA sales were 26% of all sales last month.
  6. Cash sales were only 12% of all sales last month.
  7. It took an average of 27 days to sell a home last month, which is 2 days more than the previous month (and 4 less days compared to last year).
  8. REOs were only 2% of all sales last month and short sales were 2.7%.
  9. There is only 1.69 months of housing supply in Sacramento County, which is 11% lower than it was last year at the same time.
  10. The median price declined by 2.7% last month and the average sales price also declined, though both are 10% higher than they were last year at the same time.

Some of my Favorite Graphs this Month:

Median price since 2013 in sacramento county

price metrics since 2015 in sacramento county - look at all

inventory - July 2016 - by home appraiser blog

CDOM in Sacramento County - by Sacramento Regional Appraisal Blog

Bottom of the Market in Sacramento

inventory in sacramento county Since 2011 - by sacramento appraisal blog

seasonal market in sacramento county sales volume 6

Interest Rates Since 2001 layers of the market in sacramento county - by sacramento appraisal blog

SACRAMENTO REGIONAL MARKET:

  1. The median price is 97% higher than it was in early 2012.
  2. It took 1 day longer to sell last month compared to June (but 4 less days compared to July 2015).
  3. Sales volume is about the same as it was last year at the same time.
  4. Cash sales were 14% of all sales last month.
  5. Cash sales volume is 6% lower this year than last year.
  6. FHA sales were 22% of all sales last month.
  7. FHA sales volume is down nearly 8% this year so far.
  8. There is 1.96 months of housing supply in the region right now, which is just about the same as last year during this time.
  9. The median price, average sales price, and avg price per sq ft all declined last month from June, though they’re all up 7-8% from last year.
  10. REOs were only 2% of all sales last month and short sales were the same.

Some of my Favorite Regional Graphs:

days on market in placer sac el dorado yolo county by sacramento appraisal blog interest rates inventory median price in sacramento regional market by sacramento appraisal blog - market median price and inventory in sacramento regional market 2013 median price sacramento placer yolo el dorado county Regional Inventory - by Sacramento regional appraisal blog Regional market median price - by home appraiser blog sacramento region volume - FHA and conventional - by appraiser blog

PLACER COUNTY:

  1. Today’s median price is 72% higher than it was in early 2012.
  2. It took 3 more days to sell a house last month than the previous month (but 4 less days than last year at the same time).
  3. Sales volume was down about 11% in July 2016 compared to last July and is down slightly for the year about 3%.
  4. Both FHA sales and cash sales were each 15% of all sales last month.
  5. There is 2.25 months of housing supply in Placer County right now, which is up very slightly from last year at the same time (but up 30% from last month).
  6. The median price increased about 1% from the previous month, but for a better context it’s up 10% from last year at the same time.
  7. The average price per sq ft was $216 last month (was $202 last year at the same time).
  8. The average sales price was $480K last month (up about 11% from last year).
  9. Bank owned sales were only 1% of all sales last month.
  10. Short sales were 0.07% of sales last month.

Some of my Favorite Placer County Graphs:

days on market in placer county by sacramento appraisal blog interest rates inventory median price in placer county by sacramento appraisal blog months of housing inventory in placer county by sacramento appraisal blog number of listings in PLACER county - 2016 Placer County housing inventory - by home appraiser blog Placer County price and inventory - by sacramento appraisal blog Placer County sales volume - by sacramento appraisal blog

DOWNLOAD 62 graphs HERE: Please download all graphs in this post (and more) here as a zip file. Use them for study, for your newsletter, or some on your blog. See my sharing policy for 5 ways to share (please don’t copy verbatim). Thanks.

Question: Did I miss anything? Any other market insight you’d like to add? I’d love to hear your take.

If you liked this post, subscribe by email (or RSS). Thanks for being here.

Share:

  • Click to share on Twitter (Opens in new window)
  • Click to share on Facebook (Opens in new window)
  • Click to share on LinkedIn (Opens in new window)

Filed Under: Market Trends Tagged With: 2016 real estate trends, appaisal, Appraiser, bank-owned sales, cash investors, Home Appraisal, House Appraisal, interest rates, inventory increasing, market getting soft, Placer County Real Estate Market, Sacramento County real estate market, Sacramento real estate trends, sacramento regional market, sales volume, Short Sales

Packing a market punch in Sacramento

July 15, 2015 By Ryan Lundquist 8 Comments

It’s easy to say things like, “The market is on fire” or “Buyers are hungry out there”. Yet I find vague statements don’t pack much of a punch. It’s far more powerful when we get specific. For instance, did you know sales volume is up almost 10% this year so far? Or FHA buyers were 28% of all sales this past quarter in Sacramento County? Those stats carry some weight and bring me pause.

sacramento appraisal blog - image purchased and used with permission from 123rf dot com

Goal of the Big Monthly Post: The goal of this big market update is to help highlight what the market is doing and help us describe it a bit better. If you’re local, absorb what is here and share some of the talking points below with your contacts. If you’re out of town, I’d love to hear about your market also. Email subscribers, I recommend reading this post on the blog instead of email.

Two ways to read this post:

  1. Scan the talking points and graphs quickly.
  2. Grab a cup of coffee and spend a few minutes digesting what is here.

One Paragraph to Describe the Sacramento Market: The first half of 2015 is now over, and all year buyers have expressed a huge appetite for the market. Sales volume is up about 10% in the region, and pendings have routinely been 20%+ higher each month this whole year. Sales volume in June was actually higher than it’s been in about three years. More sales has led to inventory declining, though it’s important to note more listings have definitely been hitting the market (and there have been more price reductions too). While many properties are generating multiple offers and selling very quickly, buyers are also finicky about pulling the trigger on anything that is not well-priced or with an adverse location or condition. Some sellers are severely overpricing their homes too. The median price stayed about the same last month compared to the previous month. One of the biggest factors shaping this market is the power of FHA buyers who now represent 23% of all sales in 2015 in the Sacramento region (and 27.5% of all sales last month in Sacramento County). The byproduct of more FHA buyers is stiff competition at the lower end and higher offers too (this makes overall housing stats look more impressive). As housing inventory presumably begins to increase over the next few months (as it did last year), watch out for price reductions, unrealistic expectations from sellers, and buyers gaining more power.

DOWNLOAD 64 graphs HERE (zip file): Please download all graphs in this post (and more) here as a zip file (or send me an email). Use them for study, for your newsletter, or some on your blog. See my sharing policy for 5 ways to share.

Sacramento County Market Trends for June 2015:

  1. The median price at $290,500 is 7.5% higher than one year ago (June 2014).
  2. It took an average of 30 days to sell a house last month (35 in May).
  3. Cash sales were 16% of all sales during Q2 2015 (31% in 2013).
  4. Short sales were only 5.1% of all sales in Q2 2015.
  5. REOs were only 5.3% of all sales in Q2 2015.
  6. FHA sales were 27.9% of all sales in Sacramento County in Q2 2015.
  7. Sales volume is 17.5% higher this June compared to last June.
  8. There is 1.6 months of housing inventory (2.1 months last June).
  9. The average price per sq ft is 186 (8% higher than last June).
  10. The average sales price is $323,082 (9.8% higher than last year).

price metrics since 2014 in sacramento county

inventory - June 2015 - by home appraiser blog

REOs and short sales in sacramento county - by sacramento appraisal blog

CDOM in Sacramento County - by Sacramento Appraisal Blog

cash sales - sacramento appraisal blog

cash and fha under since 2009 - sacramento appraisal blog

sales volume in Sacramento County

Median price and inventory since 2011 by sacramento appraisal blog

Sacramento Regional Trends for June 2015 (Sac, Placer, Yolo, El Dorado):

  1. Sales volume was up 17% in June 2015 compared to June 2014.
  2. Sales volume for the year is up 9.6% compared with 2014.
  3. The median price at $332,250 is 7.1% higher than one year ago (June 2014).
  4. FHA sales are up 31% this year so far.
  5. Cash sales were roughly 16% of all sales last month.
  6. It took an average of 33 days to sell a house last month (37 days in May).
  7. FHA sales were 23.7% of all sales in the region last month.
  8. There is 1.85 months of housing inventory (1.92 months in May 2015).
  9. The average sales price is $370,013 (7.9% higher than last year).
  10. It took 4 less days to sell a house this June compared to June 2014.

median price and inventory in sacramento placer yolo el dorado county

volume cash and conventional in region by sacramento appraisal blog

months of housing inventory in region by sacramento appraisal blog

days on market in placer sac el dorado yolo county by sacramento appraisal blog

median price and inventory in sacramento regional market

interest rates inventory median price in sacramento regional market by sacramento appraisal blog

Placer County Market Trends for June 2015:

  1. The median price in Placer County is $401,000.
  2. The median price is 5.5% higher than one year ago (June 2014).
  3. It took 36 days on average to sell a house last month.
  4. Cash sales were 14% of all sales last month.
  5. FHA sales were 17.8% of all sales in Placer County last month.
  6. Sales volume was 31% higher this May compared to last May.
  7. Sales volume is up 18% in 2015 compared to last year.
  8. There is 1.88 months of housing inventory (2.76 months last June).
  9. The average price per sq ft is is 200 (up from 184 last June).
  10. The average sales price is $454,643 (8% higher than June 2014).

Placer County sales volume - by sacramento appraisal blog

months of housing inventory in placer county by sacramento appraisal blog

days on market in placer county by sacramento appraisal bloginterest rates inventory median price in placer county by sacramento appraisal blog

Placer County median price since 2012 - by home appraiser blog

Placer County median price and inventory - by home appraiser blog

I hope this was helpful. Thank you so much for being here.

DOWNLOAD 64 graphs HERE (zip file): Please download all graphs in this post (and more) here as a zip file (or send me an email). Use them for study, for your newsletter, or some on your blog. See my sharing policy for 5 ways to share.

Home Office Progress: I’ve been sharing some progress on my new home office. It’s been so much fun to build and now customize. Last week I finished some cork boards and hung crown moulding. Yes, I know I need to upgrade my chair (coming soon) and have multiple monitors (coming soon).

my home office

Questions: How do you think sellers and buyers are feeling about the market right now? What are you seeing out there?

If you liked this post, subscribe by email (or RSS). Thanks for being here.

Share:

  • Click to share on Twitter (Opens in new window)
  • Click to share on Facebook (Opens in new window)
  • Click to share on LinkedIn (Opens in new window)

Filed Under: Market Trends Tagged With: Appraisal, appraisers, average price, FHA, high sales volume, home appraisers, housing inventory, less cash investors, market trends in Sacramento, Median Price, more FHA buyers, Placer County real estate, REOs, Sacramento Real Estate Market, sacramento regional market, Short Sales, trend graphs

High demand persists in the Sacramento real estate market

April 9, 2015 By Ryan Lundquist 6 Comments

What is the real estate market doing? That’s not always a quick 10-second answer you can give someone while standing in line at Starbucks. Yet here’s the scoop: Demand is very high, values are up, and inventory is down. We are seeing exactly what we would expect to see in a Spring market, and I’d like to invite you to unpack the market with me in this post so you can share specific trends with your clients.

buyers are ready to pull the trigger - image purchased by sacramento appraisal blog and used with permission

One Paragraph to Explain the Market: The market is having a normal Spring so far. Prices are up, sales volume is increasing, and housing inventory is down. Buyers are hungry out there, which is seen with pendings being 25% higher in the regional market in March 2015 compared to March 2014. Cash sales continue to decline in volume, while FHA buyers are gaining a greater share of the market. Short sales and bank-owned sales are still hovering at very low levels, though there was a slight uptick in volume this past quarter (nothing to sound the alarm about). It took an average of 51 days to sell a house in the region last month, which is 4 days longer than it took last year (thus while the market feels hot, we can also see the market is slowing down too). Well-priced listings are going quickly and experiencing multiple offers, but properties with adverse locations and/or a lack of upgrades are tending to sit on the market. There is a huge demand for quality inventory, yet at the same time the market is price sensitive since buyers are showing discretion. Many neighborhoods over these past few months experienced a seasonal increase in value (not all areas though). Remember in coming time that inventory historically sees a huge increase from April onward, and that can very easily change the tone of the market.

NOTE: This post is longer since it is my big monthly market update. I am experimenting with more graphs and less text. Do you miss the numbers and bullet points? I’d love some feedback.

Two ways to read this post:

  1. Scan the talking points and graphs quickly.
  2. Grab a cup of coffee and spend a few minutes digesting what is here

DOWNLOAD 62 graphs HERE for free (zip file): Please download all 62 graphs here as a zip file (or send me an email). Use them for study, for your newsletter, or even some on your blog. See my sharing policy for 5 ways to share.

SACRAMENTO REGION (Sac, Placer, Yolo, El Dorado):

median price and inventory in sacramento placer yolo el dorado county

days on market in placer sac el dorado yolo county by sacramento appraisal blog

months of housing inventory in region by sacramento appraisal blog

number of listings in Placer Sacramento Yolo El Dorado county - by home appraiser blog

interest rates inventory median price in sacramento regional market by sacramento appraisal blog

SACRAMENTO COUNTY:

Median price and inventory since 2012 by sacramento appraisal blog price metrics since 2014 in sacramento county

cash in sacramento county

fha and cash in sacramento county - by sacramento appraisal blog

Volume and cash since 2009 - by Sacramento Appraisal Blog

reo and short sales in sacramento county

months of housing inventory by sacramento appraisal blog

CDOM in Sacramento County - by Sacramento Appraisal Blog

sales volume through feb 2015 in sacramento county

sales volume in march in Sacramento County since 2001

PLACER COUNTY:

Placer County median price and inventory - by home appraiser blog

days on market in placer county by sacramento appraisal blog months of housing inventory in placer county by sacramento appraisal blog

Placer County median price since 2012 - by home appraiser blog

Placer County sales volume - by sacramento appraisal blog

interest rates inventory median price in placer county by sacramento appraisal blog

Questions: How do you think sellers and buyers are feeling about the market right now? What are you seeing out there?

If you liked this post, subscribe by email (or RSS). Thanks for being here.

Share:

  • Click to share on Twitter (Opens in new window)
  • Click to share on Facebook (Opens in new window)
  • Click to share on LinkedIn (Opens in new window)

Filed Under: Market Trends Tagged With: cash buyers, cash investors, El Dorado County, FHA buyers, graphs, Home Appraiser, House Appraiser, increasing values, Market Trends, Placer County, Sacramento County, Sacramento Real Estate Market, Sacramento real estate trends, sacramento regional market, Yolo County

  • Go to page 1
  • Go to page 2
  • Go to Next Page »

Primary Sidebar

Connect with Ryan

 Facebook Twitter LinkedIn YouTube Instagram

Subscribe to Weekly Post

* indicates required

Search this site

Blog Categories

  • Appraisal Stuff (407)
  • Bankruptcy (3)
  • Divorce (4)
  • Estate Settlement (6)
  • FHA Appraisal Articles (56)
  • Internet (53)
  • Market Trends (481)
  • Photos from the Field (126)
  • Property Taxes (70)
  • Random Stuff (231)
  • Resources (566)
  • Videos (161)

Blog Archives: 2009 – 2021

Lundquist Appraisal Links

  • Appraisal Order Form
  • Appraisal Website
  • Rancho Cordova Appraiser Website
  • Sacramento Appraisal Blog Sitemap
  • Sacramento Real Estate Appraiser Facebook Page
  • Twitter: Sacramento Appraiser (@SacAppraiser)
  • YouTube: Sacramento Appraiser Channel

Most Recent Posts

  • How long can this market keep going?
  • What is your housing persona?
  • Rapid price growth & the Gilmore Girls next door
  • Are first-time buyers targeting 2-4 unit properties?
  • Stale real estate headlines & buyers flocking to El Dorado County
  • My new sewer line adds huge value, right?
  • The housing market nobody predicted
  • Real estate trends to watch in 2021
  • You carried me & a spreadsheet for Christmas
  • Real estate drama (and a market update)

Disclaimer

First off, thank you for being here. Now let's get into the fine print. The material and information contained on this website is the copyrighted property of Ryan Lundquist and Lundquist Appraisal Company. Content on this website may not be reproduced or republished without prior written permission from Ryan Lundquist.

Please see my Sharing Policy on the navigation bar if you are interested in sharing portions of any content on this blog.

The information on this website is meant entirely for educational purposes and is not intended in any way to support an opinion of value for your appraisal needs or any sort of value conclusion for a loan, litigation, tax appeal or any other potential real estate or non-real estate purpose. The material found on this website is meant for casual reading only and is not intended for use in a court of law or any other legal use. Ryan will not appear in court in any capacity based on any information posted here. For more detailed market analysis to be used for an appraisal report or any appraisal-related purpose or valuation consulting, please contact Ryan at 916-595-3735 for more information.

There are no affiliate links on this blog, but there are three advertisements. Please do your homework before doing business with any advertisers as advertisements are not affiliated with this blog in any way. Two ads are located on the sidebar and one is at the bottom of each post. The ads earn a minor amount of revenue and are a simple reward for providing consistent original content to readers. If you think the ads interfere with your blog experience or the integrity of the blog somehow, let me know. I'm always open to feedback. Thank you again for being here.

Copyright © 2021 Sacramento Appraisal Blog