Prices have been pretty flat. That’s a really good way to describe the housing market lately in many areas across the country. Let’s talk about that today as well as dig into insurance. I have some encouragement to share too about mindset.

UPCOMING SPEAKING GIGS:
11/7/2024 Think Like an Appraiser (3 hours) TBA
11/19/24 Downtown Regional MLS Meeting Q&A 9am
12/5/24 Made 4 More Team (Exporting Data from MLS)
12/11/24 Gateway: Think Like an Appraiser (private)
1/15/25 Mike & Joel Event (details TBA)
1/24/25 PCAR Market Update (details TBA)
2/6/25 She Invests event (TBA)
2/11/25 MLS Meeting TBA
4/8/25 Culbertson and Gray (private I think)
11/4/25 SAR Main Meeting

HALLOWEEN COSTUME?
Is anyone dressing up for Halloween? My wife and I were invited to a costume party, so I’ll be wearing a yellow hazmat suit and respirator to emulate my favorite cook from Breaking Bad.
HAVE PRICE BEEN FLAT?
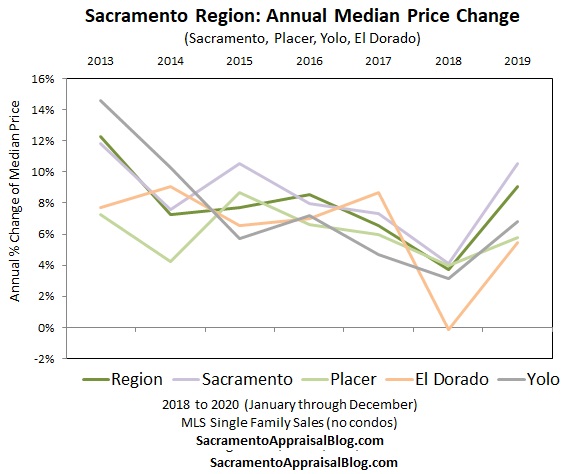
One of the best ways to describe the housing market in Sacramento and some other portions of the country is to say we’ve had very modest appreciation over the past year. In other words, prices have been pretty flat. I’m noticing this in regional stats as the median price is only about 1% higher than last year, but I’m also seeing it when pulling comps. In 2021, there was substantial change between older comps and today, but that’s just not the reality right now.
NOTE: The flat trend may not be in every neighborhood and price range, so look to the comps to understand the market.


BRO, STOP BEING SO NEGATIVE
Before saying more, I have some quick thoughts about mindset. I find sometimes there is resistance in real estate circles to saying prices have been flat, as if it could somehow change the market by being “negative.” It almost reminds me how people didn’t want to say the name “Voldemort” in Harry Potter out of fear of consequences. I’m not trying to sound preachy, but there’s a huge difference between talking about slowing housing stats and having an optimistic mindset about life and business. Those are two totally different things. My advice? If you work in real estate, take the pressure off yourself. What you say about the housing market can’t change the trend (true for my words also), and your role is to simply find people who are participating regardless of what the market is doing – whether it’s hot, cold, or mild. Look, if real estate professionals could alter the trend, we wouldn’t be seeing such crazy low sales volume right now. One more thing. I can’t transform my stock portfolio by thinking positively. I can’t change the election next week by just thinking about it. And I can’t fit into certain pairs of jeans either just because I’m positive about my body image. Look, I’m a huge optimist in life, and cultivating positivity is essential. If you’ve lost your sense of hope, you need to dig deep to find it. Fight for optimism and surround yourself with people who will build you up!!! And unsubscribe from voices that only promote doom because there is an agenda there (and they’re getting rich off your clicks). All I’m saying is a positive outlook in life is something far different than being real about housing market conditions. Sermon done.
SOME NEIGHBORHOOD EXAMPLES
Here are some examples of scatter graphs with flat prices. I realize not everyone resonates with graphs like this, but do you see how the dots are sort of going more horizontal lately? Down some from 2022 and modest price growth at best since last year. Of course, not every neighborhood will look the same, but I wanted to share these examples lately.


THE BIG TAKEAWAY & DIFFERENT TRENDS
Look, if your property checks all the boxes, it’s highly possible to get multiple offers (if priced right). And stepping back, about 40% of pendings are getting multiple offers right now in the region (a pretty normal level). But otherwise, 2024 is a different vibe compared to 2021, and it’s important to adjust and price reasonably to capture the attention of buyers. In some cases, you might see older comps and recognize there hasn’t been any real value gain too. The other day a lawyer reading my appraisal report criticized me for using a comp from one year ago, but here’s the thing. There aren’t many comps today to choose from since volume has been down so much, AND the market today is at a similar level from then, so it was actually a really solid comp that didn’t need any adjustment for price change. Obviously, the trend isn’t exactly the same in every neighborhood, so I get it if you say prices are going nuts in XYZ Neighborhood. I’m speaking generally here, and stats are supporting the idea that the overall market has been…. flat.
THE INSURANCE CRISIS ISN’T JUST ABOUT FIRES
Okay, let’s look at one more big trend. We’ve been talking so much about the insurance crisis in outlying areas prone to fires, but one place we’re seeing insurance carnage is with condos / HOA communities. It’s not that individual owners are having a problem obtaining insurance, but the association itself is experiencing a massive rise in the cost of insurance, and that’s often passed on to owners with HOA fee increases. But it’s more than just the HOA fee. Check out my Facebook post yesterday where people chimed in about financing issues due to the HOA having insufficient funds, and even SB 326, which requires some condominium associations to inspect and repair balconies. All that said, condo sales have been slumping this year compared to detached units, which has caused condo inventory to spike. In short, watch condos carefully and recognize there could be some brewing downward price pressure here.

I hope this was interesting or helpful.
Questions: What have prices been doing in the neighborhoods you cover? What are you noticing about condos?
If you liked this post, subscribe by email (or RSS). Thanks for being here.