• Skip to primary navigation
  • Skip to main content
  • Skip to primary sidebar

Sacramento Appraisal Blog | Real Estate Appraiser

Real estate appraisals for divorce, estate settlement, loans, property tax appeal, pre-listing and more. We cover Sacramento, Placer and Yolo County. We're professional, courteous and timely.

  • About
  • Appraisals
  • Order
  • Ask Ryan
  • Areas
  • Classes
  • Press
  • Trends
  • Share
  • Contact

Downtown

Sellers, you don’t need 20 offers

September 8, 2020 By Ryan Lundquist 27 Comments

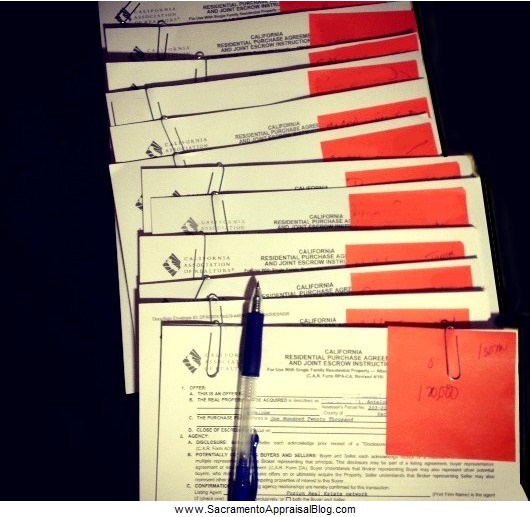
Sellers, getting twenty offers is the dream, right? That way you can be choosy about accepting the buyer with the strongest terms and probably a higher price too. But do you really need that many? In other words, can you get the same price with just a few offers? Let’s kick around this idea today.

THE SHORT VERSION:

1) No surprise. Getting more offers tends to lead to a higher sales price.
2) Sometimes just one offer can go way above the list price.
3) Homes with one offer also more regularly close way below the list price.
4) You don’t need 20 offers (but it sure does help).

THE LONGER VERSION:

Let’s look at some visuals and then consider some takeaways.

County Visuals: First off, I’m concerned these visuals are going to be confusing, so sorry if you’re thinking, “Dude, I only see dots and I have no idea what’s going on.” The goal is to show how much higher the sales price is compared to the original list price while considering the number of offers. Basically, when a dot is at 100%, it means a home sold at exactly the original list price. Or if a dot is at 110%, it sold 10% above the list price. Or 95% means it sold 5% lower than the original list price.

Question: What happens to prices when there are more offers?

The big plain truth: The truth is properties with more offers tend to close higher above the original list price than properties with fewer offers. Duh, I know we could have said that without the research, but it’s good to see what stats actually show rather than going with what we feel might be true. With that said, sometimes a home with just one offer can actually close at the same high percentage above the list price as a home with ten offers. So technically you don’t need ten to twenty offers to command a huge price (but it sure does help).

Neighborhood Visuals: Let’s check out some neighborhoods too instead of just the county. What do you see?

Conclusion: There are fewer data points to consider in the neighborhood visuals, but the takeaway is the same as the county (see above).

QUICK THOUGHTS:

1) 20 offers: If you’re getting 20 offers, it’s probably because you’re priced too low unless that’s what every listing is getting.

2) Aim for a few: Price it reasonably and you’re more likely to command a few solid offers and statistically be in the zone to compete above the list price. The reality is you don’t need 20 offers to get a huge price (but it helps).

3) Hang in there buyers: It’s not easy out there right now, but it’s worth noting not every sale is getting ten offers. It may feel true, but the stats don’t show it is.

4) Not everything is getting bid up: While many properties go 10% to 15% above the original list price, many homes sell below the list price. The narrative is Bay Area buyers are swooping in, paying cash, and everything is getting bid up, but that’s not true when looking at how many homes recently sold below the original list price (basically any dots below the 100% line).

5) Clear advantage: Having lots of offers gives sellers a huge advantage to be selective and accept contracts with the best terms (and probably higher prices).

6) Layers of the market: Not every price range is experiencing the same dynamic when it comes to multiple offers and getting bid up. This is why it’s so dangerous to take an experience with just one property and call it a trend for the market. Maybe. Maybe not.

I hope that was helpful. Thanks for being here.

Questions: How many offers do you think is ideal for a seller to get? Why are some listings able to command a huge price even though they only get one or two offers? What is it about those ones? Any other insight? I’d love to hear your take.

If you liked this post, subscribe by email (or RSS). Thanks for being here.

Share:

  • Click to share on Twitter (Opens in new window)
  • Click to share on Facebook (Opens in new window)
  • Click to share on LinkedIn (Opens in new window)

Filed Under: Market Trends Tagged With: Appraisal, Appraiser, bidding wars, buyers, competitive market in Sacramento, Downtown, East Sac, East Sacramento, El Dorado County, Home Appraisal, homes getting bid up, House Appraisal, housing market, Midtown, Oak Park, Placer County, real estate trends, Ryan Lundquist, Sacramento County, sacramento regional appraisal blog, sellers, Tahoe Park, Whitney Ranch

Moving money, duplexes, & unicorns.

February 26, 2020 By Ryan Lundquist 21 Comments

Moving money, duplexes, and unicorns. This sounds like a seriously boring blog post, but this is fascinating stuff and I hope you walk away with insight and maybe some ideas for where to focus business if you work in real estate. If you’re not local, are these trends happening in your market? I challenge you to find out.

Increasing 1031 Exchange Sales: Here’s an image to show all 1031 Exchange sales in the Sacramento region over the past two decades. In short, a 1031 Exchange is a way an investor basically swaps one property for another to minimize the tax burden. Often investors from outside a market will move money into a lower-priced market too, but that’s not always the case. Anyway, here are all 1031 Exchange sales on one graph. I know, there are way too many dots here. But do you see two main clusters? There were more sales in the last rising market cycle and there are more in today’s market.

I spoke with a 1031 Exchange guy and he echoed this is exactly the trend he is seeing out there. When a market is rising, investors tend to move money. I will say the stats here are not perfect because these are only sales where agents have input a 1031 happening. However, I believe most importantly we still have an accurate trend to see about the frequency of 1031s happening. For what it’s worth, about 85% of these exchanges were single family homes, so clearly investors wanting to park money in Sacramento aren’t just looking to the 2-4 unit market.

Brand new duplexes: This might not seem like a big deal, but here are four recent duplex builds in Sacramento. This hardly seems like a trend or worth mentioning, but being that there are literally about a dozen new duplex sales over the past ten years, it’s a big deal to see four right now. The good news for today is it’s possible in some situations to build a duplex and make the numbers work. We have a severe housing shortage in California too, so seeing more multi-unit properties is definitely something we desperately need.

Unicorn advice: If you are going to build a duplex, keep your costs down somehow and do something modern as it seems like units with a modern / contemporary feel are the ones selling at the top. Also, sometimes we see out-of-town investors pay more for two-unit properties. That’s a very real dynamic. Know that unicorn buyers are out there and when I see 2-4 unit properties sell for too much it’s often a Bay Area buyer (or 1031 Exchange). But be careful about pricing too high because that’s a quick way to get zero offers (seriously). My advice? Price for the market instead of the unicorn.

REGIONAL DUPLEX SALES: Here’s a quick look at two-unit (duplex) sales over the past two decades in the Sacramento region. I committed graph sin by not explaining “region” on the image (it’s Sacramento, Placer, Yolo, El Dorado county). What do you see?

A DIFFERENT TREND: When looking at Midtown and Downtown there is clearly a different trend. The rest of the two-unit market hasn’t quite seemed to eclipse where prices were in 2005, but that’s absolutely not the case in Midtown. It just goes to show the market isn’t showing the same trend everywhere. 

Anyway, I hope that was helpful. Thanks for being here.

Questions: What stands out to you about the images above? What have you noticed about the duplex market? Anything to add?

If you liked this post, subscribe by email (or RSS). Thanks for being here.

Share:

  • Click to share on Twitter (Opens in new window)
  • Click to share on Facebook (Opens in new window)
  • Click to share on LinkedIn (Opens in new window)

Filed Under: Market Trends Tagged With: 1031 exchange sales, 2-4 unit sales, brand new duplexes, Downtown, duplex market sacramento, Duplex sales, Home Appraiser, House Appraisal, housing shortage, Midtown, sacramento regional appraisal blog, trend graphs

Seeing real estate trends in Sacramento (you pick the neighborhood)

March 5, 2014 By Ryan Lundquist 6 Comments

Let’s look at some specific neighborhoods today in Sacramento. How is the real estate market evolving in each of these areas? In this post I plan to include 10 graphs, but the fun part is YOU CHOOSE which ones I make.

HOW IT WORKS: Email me a request to graph a specific neighborhood or area. I’ll then make a graph like the ones below and post it here over the next few days. Keep checking back. You can use the graph as personal research, for a listing presentation or post online as you see fit. I’ll need three things:

  1. Name: Location or name of neighborhood (in Sacramento, Placer or Yolo).
  2. Time: How many years of sales do you want on the graph (1 to 5 years)?
  3. Other: Do you want to see all sales? Or would you like to refine data to see a certain square footage range, bedroom count, etc…?

Send me a quick email? Seriously. ryan@lundquistcompany.com

NOTE: I have all graphs in larger sizes if you need them. Just email me.

1) Antelope: Here all all sales over the past 5 years in Antelope per request of Scott. Isn’t it interesting to see how the market has moved? Bottomed out in early 2012, massive appreciation and then leveling off.

All Antelope Sales - 530

2) Days on Market for Antelope Sales: How long have sales in Antelope spent on the market? Here are all sales. A chart of average number of days on market each month or quarter would be great, but maybe in a different post.

days on market for all sales in Antelope in MLS - 530

3) Midtown/Downtown: Per request in a comment below, here are all sales in Midtown/Downtown from 0-2 bedrooms and under 1000 sq ft. This graph only includes single family sales – NOT condos. What do you see?

Midtown Downtown Sales in Sacramento - SFR Detached Only - NOT Condos

4) Elk Grove: Per request of Bruce, here are all sales between Bruceville, Franklin, Bilby and Elk Grove Blvd. This is the 95757 zip code. Any thoughts?

Elk Grove Market Trends - by Sacramento Appraisal Blog - 530

5) Arden Manor: Per request of Cass, here are all 3-Bed / 1-Bath sales in Arden Manor (located off Watt Avenue in Sacramento in case you are not familiar).

Arden Manor Sales - by Sacramento Appraisal Blog - 530

6) Carmichael: Per request of Susan, here are all 3-4 bedroom sales in Carmichael over the past five years. I took the liberty to include only sales under $1,000,000 because there were only a handful above that level (and including them made the graph less legible). It would be interesting to see a precise square footage range in Carmichael as a follow-up to this graph.

carmichael sales 3-4 bedrooms - 530

7) Natomas: Here are all sales in the 95835 zip code for houses at 3200 sq ft or larger (hope you like this one John).

Natomas 95835 Sales - 3200 sq ft and larger - 530

8) Elk Grove: This is a graph of all sales in Elk Grove under $400,000 with 3-4 bedrooms, 1500-3000 sq ft of living area and properties built between 1997 to 2007. Hope you like it Gary.

Elk Grove Market Data - 530

9) Condos in City of Sacramento: This pie graph helps shows all condo sales in the City of Sacramento from 2010 to 2014 – and it really says something about the market, doesn’t it? Being that many condo complexes have too many rentals, pending litigation or some other issue that is a turn-off for financing, there has been a very high percentage of cash purchases. Note this is the City of Sacramento and NOT the entire county. Hope you enjoy this one Barbara.

condo sales in city of sacramento

10) Laguna West in Elk Grove: Here are all sales with a gross living area between 2400-3000 and with no pool in the Laguna West neighborhood over the past three years. Hope you like this one Doug.

Laguna West Sales - 2400-3000 GLA - no pool - 530

Examples for Blog Post:

1479 model in Mather

Mather: This graphs shows all 1479 model sales in Mather over the past five years. I appraised a model recently that was priced beyond the highest recent sale. It was out of sync with the market.

Gold River Station Sales

Gold River Station: It’s easy to confuse Gold River Station with Gold River, but they are two different areas. Gold River Station is located just north of Highway 50 and immediately south of the Gold River HOA. Gold River Station is not a part of Gold River, which is important to consider when choosing comparable sales.

Any thoughts, insight or questions?

If you liked this post, subscribe by email (or RSS). Thanks for being here.

Share:

  • Click to share on Twitter (Opens in new window)
  • Click to share on Facebook (Opens in new window)
  • Click to share on LinkedIn (Opens in new window)

Filed Under: Market Trends Tagged With: 95757 zip code, 95835 zip code, Antelope Sales, Arden Manor, Arden Manor sales, Carmichael, cash sales condos, Condos in Sacramento, Downtown, Elk Grove Real Estate, Gold River Station, Graph of Sales in Antelope, graphs of sales, Home Appraiser, House Appraiser, Laguna West, Market Trends, Mather, Midtown, Natomas, real estate sales Carmichael, Sacramento Neighborhoods, Sacramento Real Estate, trend graphs

Primary Sidebar

Connect with Ryan

 Facebook Twitter LinkedIn YouTube Instagram

Subscribe to Weekly Post

* indicates required

Search this site

Blog Categories

  • Appraisal Stuff (407)
  • Bankruptcy (3)
  • Divorce (4)
  • Estate Settlement (6)
  • FHA Appraisal Articles (56)
  • Internet (53)
  • Market Trends (482)
  • Photos from the Field (126)
  • Property Taxes (70)
  • Random Stuff (231)
  • Resources (566)
  • Videos (161)

Blog Archives: 2009 – 2021

Lundquist Appraisal Links

  • Appraisal Order Form
  • Appraisal Website
  • Rancho Cordova Appraiser Website
  • Sacramento Appraisal Blog Sitemap
  • Sacramento Real Estate Appraiser Facebook Page
  • Twitter: Sacramento Appraiser (@SacAppraiser)
  • YouTube: Sacramento Appraiser Channel

Most Recent Posts

  • How much have prices risen since 2012?
  • How long can this market keep going?
  • What is your housing persona?
  • Rapid price growth & the Gilmore Girls next door
  • Are first-time buyers targeting 2-4 unit properties?
  • Stale real estate headlines & buyers flocking to El Dorado County
  • My new sewer line adds huge value, right?
  • The housing market nobody predicted
  • Real estate trends to watch in 2021
  • You carried me & a spreadsheet for Christmas

Disclaimer

First off, thank you for being here. Now let's get into the fine print. The material and information contained on this website is the copyrighted property of Ryan Lundquist and Lundquist Appraisal Company. Content on this website may not be reproduced or republished without prior written permission from Ryan Lundquist.

Please see my Sharing Policy on the navigation bar if you are interested in sharing portions of any content on this blog.

The information on this website is meant entirely for educational purposes and is not intended in any way to support an opinion of value for your appraisal needs or any sort of value conclusion for a loan, litigation, tax appeal or any other potential real estate or non-real estate purpose. The material found on this website is meant for casual reading only and is not intended for use in a court of law or any other legal use. Ryan will not appear in court in any capacity based on any information posted here. For more detailed market analysis to be used for an appraisal report or any appraisal-related purpose or valuation consulting, please contact Ryan at 916-595-3735 for more information.

There are no affiliate links on this blog, but there are three advertisements. Please do your homework before doing business with any advertisers as advertisements are not affiliated with this blog in any way. Two ads are located on the sidebar and one is at the bottom of each post. The ads earn a minor amount of revenue and are a simple reward for providing consistent original content to readers. If you think the ads interfere with your blog experience or the integrity of the blog somehow, let me know. I'm always open to feedback. Thank you again for being here.

Copyright © 2021 Sacramento Appraisal Blog