El Dorado County
The story of Sacramento’s regional housing market in 2014
How much did values increase last year in the Sacramento Region? What about Placer County? How would you describe the market to friends or clients? Let’s take a stroll through the trends today.
Dude, this is a long post: If you’re new to subscribe (thank you), most of my posts are not this long. But twice a month I break down the local trends so we can better know how the market is moving. If you are outside of the area, you can still glean from what is here. Beyond these two monthly posts, my other posts tend to be general enough to apply throughout the United States.
Two ways to read this post:
- Scan the talking points and graphs quickly.
- Grab a cup of coffee and spend a few minutes digesting what is here.
Thank you for being here.
SACRAMENTO REGION (scroll below for Placer County)

Email me if you want the graphs: If you would like all the graphs in this post (and others), send me an email (make sure to write “I want the market graphs” in the header). You can use these in your newsletter, some on your blog, and some in other social spaces. See my sharing policy for ways to share.
Regional Market Year-End Stats:
1) Median Price ended at $309,000
2) Average Sales Price ended at $339,182
3) Average Price per sq ft ended at $179
4) Sales volume was down 6.6% in 2014 compared to 2013.
5) FHA sales increased by 4.6% from 2013.
6) There were 32% less cash sales this year.
7) Short sales represented only 6.7% of the entire market in 2014.
8) Bank-owned sales were only 5.8% of all sales in 2014.
1) Values saw a modest uptick, but the market was flat for most of the year:
 The graph above shows an increase in the median price at the beginning of the year, but then the market was basically flat for more than half the year. Overall the median price increased by 10.3%, the average price per sq ft increased by 5.3%, and the average price increased by 6.6%.

2) Cash volume declined by 32% this year in the regional market:

Having 32% less cash sales in 2014 definitely softened up the market compared to 2013. For much of the year there was a sense the market was “normalizing” in that it was learning how to exist without cash investors driving the market, inventory was approaching more normal-ish levels, and interest rates were increasing. Of course now that rates have begun to decline again, that will help put a bit more “steroid” back into the market.
3) Sales volume was down by 6.6% in the region:

There were almost 1800 less sales this year in the Sacramento region, which translated to a sales volume at 6.6% lower than the previous year. This year volume was lower, and we began to get a better picture of what real demand is like in the Sacramento market. In 2012 and 2013 we saw a market that was driven by buyers outside of our market (investors). In short, the demand wasn’t a result of the local market or the local economy. But this year we saw a market that was more driven by local buyers, which is why volume was so much lower than the previous year. Granted, interest rates are still helping buyers afford far more than their wages would otherwise allow, and that’s going to be important to watch over time.
4) Housing inventory increased over the year (declined in December):

Housing inventory saw a clear upward trek throughout 2014. There was not a steady increase every single month, but overall the trend was increasing, wasn’t it? The truth is in real estate some months are going to be higher or lower in a particular category, and sometimes data will even seem conflicting. That’s why we need to look at the big picture as well as hyper-local neighborhood data and county-wide data. It all helps us understand and tell the story of the market.

Here is what inventory looks like in December. We should see increases this next month as some properties slowly begin to hit the market. We like to think real estate fever begins in March, but remember the sales in March are often the pendings from February.
5) It’s taking about 25% longer to sell a house in today’s market (but 35% more quickly than it was three years ago):

These days it’s taking about 25% longer to sell a house than it did last year. This sounds alarming, but let’s remember this is normal. We remember the days in mid-2013 when it was actually taking less than 30 days on average to sell a house. That was insane. For context, at the end of 2011 it was taking about 90 days to sell a house in the Sacramento region (that was three years ago). Of course I still recommend pricing to sell in 30 days or less so you hit the sweet spot of buyers looking for properties. In most price ranges you don’t want to be on the market for 90 days right now because you begin to lose your power to negotiate a higher price with buyers.
6) Listings and Trends:

Here is the price spread of current listings in the regional market. The bulk of current listings are priced between 200-400K. We can also see as of last month there were only 50 properties for sale under $100,000. It’s just no longer the market to pick something up for dirt cheap.

Last but not least, here is a picture of some of the “layers of the market” working together.
Email me if you want the graphs: If you would like all the graphs in this post (and others), send me an email (make sure to write “I want the market graphs” in the header). You can use these in your newsletter, some on your blog, and some in other social spaces. See my sharing policy for ways to share.
PLACER COUNTY MARKET TRENDS

Placer County Year-End Stats:
1) Median Price ended at $387,000
2) Average Sales Price ended at $428,629
3) Average Price per sq ft ended at $192
4) Sales volume was down 2.96% in 2014 compared to 2013.
5) FHA sales decreased by 9% from 2013 (76 less sales).
6) There were 19% less cash sales this year.
7) Short sales represented only 5% of the entire market in 2014.
8) Bank-owned sales were only 3.5% of all sales in 2014.
Email me if you want the graphs: If you would like all the graphs in this post (and others), send me an email (make sure to write “I want the market graphs” in the header). You can use these in your newsletter, some on your blog, and some in other social spaces. See my sharing policy for ways to share.
1) Values increased only a few percent over the year:

How much did the market increase in Placer County last year? Overall the median price increased by 8.1%, the average sales price increased by 6.3%, and the average price per sq ft increased by 7.8%. The market saw some appreciation in the beginning of the year, but was fairly flat and really softened over the last two quarters. The stats actually seem a bit higher than the market felt in light of December’s numbers (which were quite a bit higher than the past few months). For instance, the median price had cooled to $375,000 in October, then $365,000 in November, and then December showed up at $387,000, which is just $1,000 under the highest monthly median price of the year. We’ll see how this figure pans out in coming months, but don’t put too much weight on it. As I said a couple days ago when discussing Sacramento, remember that these figures don’t necessarily mean each property has increased in value by 8.1%, 6.3%, or 7.8%. Actual value is only something we can determine on an individual basis.
2) Inventory increased steadily over the year (down in December):
 Housing inventory in Placer County increased steadily throughout the year and was hovering in the higher 2s for the most part. It peaked once over three months at the end of the year, and saw a dramatic Fall to 1.8 months in December (its very normal for inventory to decline in December because there aren’t many new listings coming on the market).

Housing inventory was freakishly low in Placer County last month (besides the market about $1M). Keep in mind there are only four listings below $100,000, so don’t put any weight on the “4” number you see for inventory under 100K.
3) It’s taking 20-25% longer to sell a house in today’s market:

Last year at this time it was taking anywhere from 45 to 50 days to sell a house, and this year it was taking anywhere from 55 to 60 days to sell a house. Well, technically on average it took 61 days to sell a house last month in Placer County. It’s normal for properties to take longer to sell in the Fall months, and then shorter when the market heats up during the Spring. As you can see, there are different price segments that tend to sell more quickly than others. Generally speaking, the higher the price, the longer it takes to sell.
4) Sales volume was down 2.9% in 2014 compared to last year:

There were 164 less sales in 2014 in Placer County compared with the previous year. This translates to sales volume being 2.9% lower compared to 2013. In contrast, Sacramento County had a volume that was 7.7% lower than the previous year.
5) The Fall showed a normal real estate seasonal cycle:
 It felt like a fairly normal Fall for the most part (beyond the higher uptick in median price). Remember, don’t make too much of the median price. It may have increased 6% from the previous month, but the average price per sq ft only went up 1%. What does that tell us?
6) The layers of the market at work:

Real estate is never just about supply and demand. There are so many “layers of the market” that are working to impact the direction of values. Both interest rates and housing inventory will be important factors to watch this coming year.
Thanks for letting me post today. I know these posts are long, but twice a month we get to delve into some big-time real estate trends, and I hope it’s been helpful for you (I know it is for me). The more we can explain what the market is doing and why it is doing it, the more we can help our clients make informed real estate decisions.
Questions: What else are you seeing out there? Anything you’d add?
If you liked this post, subscribe by email (or RSS). Thanks for being here.
5 trends to watch in Sacramento’s regional real estate market
If you want to understand real estate, it’s important to see the big picture. It’s one thing to unpack trends for a neighborhood or county, but when we take a panoramic view of the region we can often get a fuller sense of how the market is really moving. Buckle up and let’s go for a quick tour of five trends to watch in Sacramento’s regional market. Remember, I do two big market posts around the second week each month, and there are two ways to read these posts. You can scan the highlighted text quickly or take a few minutes to digest what is here.


THE SACRAMENTO REGION:
1) Prices have been flat for three months in the Sacramento Region:

The median price has been the same for three months in the Sacramento Region, which shows the market has definitely cooled off. There may be some sub-markets that are still hot and showing increases in value, but the overall trend for the region is very telling. When looking at the median price, average price per sq ft, and average sales price in multiple counties, the market as a whole has been clearly flat for the past 90 days.
 Quote in SacBiz: By the way, I was quoted in the Sacramento Business Journal yesterday in an article about the slow market. Check it out at Slower real estate market could just be normalizing. It’s always an honor to share my two cents. I’d love to hear your take on the market too.
2) Inventory is steadily increasing in the Sacramento Region:

Housing inventory has been increasing in the Sacramento Region over the past several months, which is creating more opportunity for buyers to get into contract (and be more picky). This has also increased competition for sellers to compete for a smaller pool of buyers. Inventory is still relatively low, which means well-priced properties are generating quick and multiple offers, yet there are also ample price reductions since many properties are simply overpriced. Sellers, pay attention to this trend because you need to price your property correctly in this market or it is going to sit.

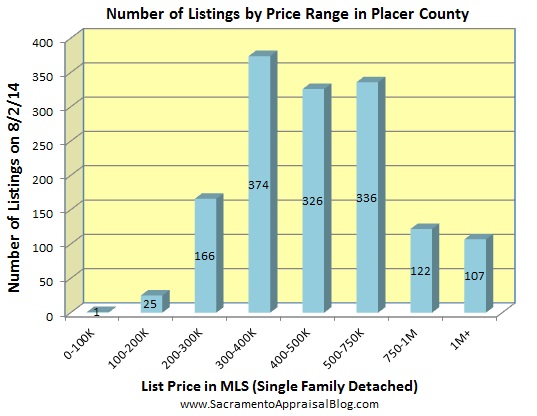
The higher the price, the more inventory there is. This is a normal trend, but it’s always interesting to see, isn’t it? Moreover, when we know how much inventory there is at a certain price range, we can help coach buyers and sellers about what they might expect.

3) It’s taking 40 days on average to sell a house in the Sacramento Region:
 Last month it took three days longer to sell a property compared with the previous month, which is one more sign the market is slowing down. Before calling in the troops and sounding the alarm, remember it’s normal for the market to cool off as summer fades away. Generally speaking, the higher the price, the longer it is taking to sell.
4) There are 6% more listings this month compared to last month:

The number of listings jumped by about 6% from last month to this month, while the number of sales rose by just over 2% (pending sales did increase though). Overall since the number of listings outpaced sales and pendings, inventory saw an increase.
5) Sales volume is down by 11% from last year in the Sacramento Region:

Sales volume is down about 11% from where it was last year for the Sacramento region. Why? In large part it’s a reaction to investors stepping away from the market one year ago. Less cash sales in the region created a gap in sales, and the market is simply trying to figure out how to normalize or adjust now that investors have taken their foot off the gas pedal. You can see in the graph above how there has been about the same number of non-cash sales in 2013 and 2014, but the number of cash sales is very noticeably down this year. Keep in mind investors didn’t gut the market in Placer County or El Dorado County like they did in Sacramento County, but what happens in surrounding areas still matters for market trends.
BONUS MATERIAL: PLACER COUNTY


Prices have been flat in Placer County: Just like Sacramento County, Placer County is best described as flat. The median price saw a dip to $379,000 from $380,000 this month, but overall has been hovering around $380,000 for three months in a row after a small seasonal uptick this spring. It seems the peak of summer has hit, so it is likely to see the market soften up over the Fall (which is completely normal to see). Last year the market felt really sluggish though at this time in light of the looming government shutdown. This year we don’t have the same phenomenon, so the market is a bit different.


Inventory saw a very minor decline last month: Monthly inventory saw a very slight decrease, but really it’s still hovering at about the same level. As you can see, inventory above $750,000 is far different from the rest of the market. Generally speaking, the higher the price, the more inventory there is.

It’s taking one week longer to sell compared to last month: On average it is taking 45 days to sell a home in Placer County as opposed to 37 days in Sacramento County (and 40 days in the Sacramento Region). Generally speaking, the higher the price, the longer it is taking to sell (which is normal). There were only 14 sales between 100-200K, so take the days on market with a grain of salt. Overall it took about one week longer to sell a home last month compared to the previous month.

Sales volume is approaching more normal levels: Sales volume saw an increase last month, but volume is still down by 7.5% from July 2013. Overall volume is starting to hit much more normal levels.
There are more listings this month than last month: Listings increased by 5% from last month to this month. At the beginning of July there were 1387 active listings on the market, and at the beginning of August there were 1457 listings. This isn’t news to write home over, but the number of listings is something important to watch because if sales don’t increase at the same rate, the market will inevitably soften. Inventory actually went down slightly though in July in light of sales slightly outpacing listings in Placer County (very slight decline).

It’s a joy to put these graphs together every month. Yes, it takes quite a bit of time, but it’s worth it. As always, I’d love to hear your take on how the market is unfolding too. Moreover, if you have ideas for how to refine or present trends, I’m always game to get some constructive feedback.
Sharing Trends with your Clients? If you want to share graphs online or in your newsletter, please see my sharing policy. Thank you for sharing.
Questions: How else would you describe the market? I’d love to hear your take.
If you liked this post, subscribe by email (or RSS). Thanks for being here.
The battle of unemployment in Greater Sacramento
How is unemployment doing in the Greater Sacramento Region? Have a look below at Sacramento County and ten surrounding counties. Data from EDD – December 2010.
What stands out to you about these rates?
 12.7% El Dorado County
20.1% Merced County
11.2% Nevada County
11.2% Placer County
12.6% Sacramento County
18.0% San Joaquin County
12.1% Solano County
17.6% Stanislaus County
21.5% Sutter County
14.3% Yolo County
19.4% Yuba County
If you have any real estate appraisal, valuation consulting, or property tax appeal needs, contact me at 916.595.3735, www.LundquistCompany.com or via Facebook.
The market ripened early this year. Buyers have simply been ready before sellers. On one hand listings and sales have been at fairly normal levels for the first two months of the year, so we can say the market is normal in that regard. But buyer demand really took off last month as pendings in the regional market were up by almost 30% compared to last February. This is the part that is not normal, and why we can say the Spring market ripened early.
One Paragraph to Explain the Market: Well-priced listings are going quickly and experiencing multiple offers, but otherwise properties are sitting on the market if they are not priced correctly. Buyers have been anxious to get into contract, but at the same time they seem to be showing discretion by not readily pulling the trigger on homes with adverse locations or issues. This has led to a sense of many current listings feeling like leftovers since they’ve been well vetted like thrift store clothing. The good news is we are reaching the time of year where more listings should be hitting the market to help alleviate the pressure of a lack of good inventory. Lastly, it took a few less days to sell last month, inventory decreased, and the sales to original list price ratio increased (all normal in Spring).
NOTE: I am posting once a week now, and this means my big monthly post will have less text, but a few more graphs (Placer, Sacramento County, & Regional Market).
Two ways to read this post:
DOWNLOAD 45+ graphs HERE for free (zip file): Please download these 45+ graphs here as a zip file (or send me an email). Use them for study, for your newsletter, or even some on your blog. See my sharing policy for 5 ways to share.
SACRAMENTO COUNTY:
PLACER COUNTY:
SACRAMENTO REGION (Sac, Placer, Yolo, El Dorado):
Questions: What is driving buyers to get into contract? Is it low rates? Is it a sense of needing to get in a home before values rise too quickly? What do you think?
If you liked this post, subscribe by email (or RSS). Thanks for being here.