I have two things on my mind today. Scott Peterson’s house hit the market. And price growth has been raging so far in 2022. Let’s talk about this.
Think Like an Appraiser Class: I’m teaching my favorite class on April 28 from 9am-12pm. We’ll talk through choosing comps, making adjustments, and lots of practical scenarios. Hope to see you there.
SCOTT PETERSON’S HOUSE IS ON THE MARKET
Last week Scott Peterson‘s old house listed for sale again, and it’s always a wonder how a house with a history might be perceived. If you don’t remember, about twenty years ago Mr. Peterson was charged with killing his wife and unborn child. The disappearance of Laci Peterson was national news.

History of sales: This property was purchased by Scott and Laci in 2000, sold toward the top of the market in 2005, sold as a foreclosure in 2007, and then sold as a short sale in 2013.
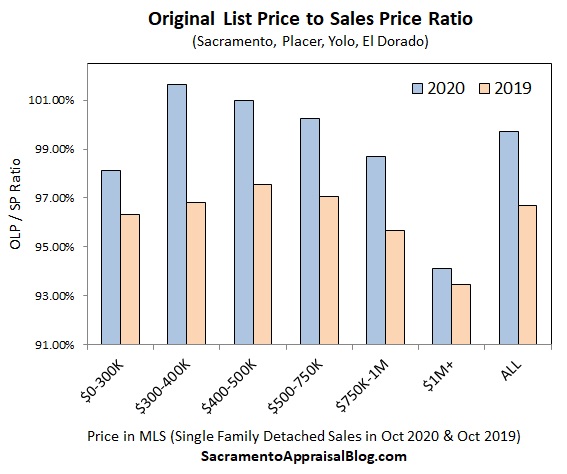
Price position: My observation is this house has had a fairly similar price position through the years despite the history. Right now, the property is listed for sale at $459,888, which is an extremely aggressive price point in Modesto. In fact, last month on average, properties between $400,000 and $500,000 sold 4.5% above their original list price. In short, this house isn’t going to be for everyone, but a house with some history or baggage doesn’t always automatically sell for a discount either. I wrote fame and real estate a few years back. Would you buy this house? Why or why not?
I shared some thoughts about this property with CBS 13 a few days ago.
RAPID PRICE GROWTH IN 2022:
Switching gears, we’ve seen explosive price growth so far in 2022. It’s been like a slap in the face to buyers (sorry, an Oscars reference). Seriously though, despite mortgage rate increases, the market has been moving really fast. A better way to put it would be to say BECAUSE of rate increases, buyers have been running to the market. Stay tuned for an exhaustive market update out next week. I’ll definitely talk more then about market temperature (something that is always changing).

Massive growth in our eleventh year: Look at the growth between January and March. This is our eleventh year of price growth, and we’ve seen really strong growth despite prices already being so high. In terms of the dollar amount, this was a record-breaking two-month stretch to see the median price up about $60,000 in the region from January to March. The percentage growth was also stunning. The market was legitimately slowing down through 2019, so had the trend persisted, it’s likely we would have been talking about 5% growth so far this year instead of just over 10%.
Be careful: This does NOT mean every house is worth 10% more since January. It would be a massive mistake to arbitrarily apply this regional metric to your house. My advice? Be infatuated with neighborhood comps instead of county or regional price metrics. In other words, price reasonably according to the comps – NOT price metrics like these. Keep in mind, not all zip codes and counties have risen by the same amount either. For instance, Sacramento County’s median is up 7.1% ($37,000) since January.


MARKET STATS: I’ll have lots of market stats out this week on my social channels, so watch Twitter, Instagram, LinkedIn, and Facebook.
Thanks for being here.
Questions: Would you buy Scott Peterson’s old house? Why or why not? What do you think of the price growth we’ve been seeing lately?
If you liked this post, subscribe by email (or RSS). Thanks for being here.


 Free webinar next week: I’m doing a big market update next week for SAFE Credit Union on November 19th from 9-10am PST.