A seller’s Zestimate is really low and he’s pretty worried about it. It might seem a bit vain to care so much, but the seller is concerned since he’s heard buyers might offer less on his home if Zillow’s estimate is too low. Is that legit? Let’s talk about it. Then for those interested I have a huge market update below.

Three things about sellers caring too much about Zillow:
1) Some buyers need education: Some buyers do get hung up on Zillow, but these buyers are very likely the minority. Frankly, a buyer putting more weight on Zillow than actual comps or neighborhood trends is simply coming to the market as misinformed.
2) Obsession means more: If a home really is worth more than a Zestimate, buyers will recognize that and offer accordingly. In other words, the vast bulk of buyers won’t be getting stuck on a lower Zestimate when they know value is there. Will some? Maybe. But let’s remember the obsessive nature of buyers today. They scour all homes as soon as they hit the market, they’re in tune with every price reduction, and they often get a sense for what is both overpriced and underpriced in a neighborhood because they’re paying such close attention. Thus to think a buyer in today’s big data climate would forget about all the hours of obsessive research and get stuck on a Zestimate is out of sync with how buyers are approaching the market today.
3) Matching the list price: The irony is the Zestimate might actually end up chasing the list price when the home does come to the market. This doesn’t always happen, but there are numerous examples online of a Zestimate being really low only to be changed within days of the listing to match whatever the list price ends up being. Here’s a lopsided example I noticed with a Chip & Jo house and here’s a recent example from Jim the Realtor in San Diego.
NOTE: I wrote about Zillow two weeks in a row. It won’t be three next week.
Any thoughts?
—–——– Big local monthly market update (long on purpose) —–——–
If I had to boil down the market to a few phrases I’d say fairly normal stats, slumping sales volume, modest price growth, overpricing sellers, and some hesitancy among buyers. Ultimately stats are showing about what we’d expect for this time of year, which is why I’m saying the market feels mostly normal. This doesn’t mean there aren’t red flags of course.
DOWNLOAD 90+ visuals: Please download all graphs here as a zip file. See my sharing policy for 5 ways to share (please don’t copy verbatim).
THE SHORT VERSION:
- Stats feel mostly normal

- Not every fall season is the same
- Rent control hasn’t stopped the market
- Year-over-year price growth is modest
- Sacramento is busting landlords for MJ
- Distressed sales hardly exist
- Volume was up this past month (but it was still a low month)
- We’re about to have a new soccer stadium
THE LONGER VERSION:
Here are some of the bigger topics right now:
Prices likely peaked for the season: Prices have been flattening or softening in most areas in the region. This doesn’t mean the market is dull or not competitive. It simply means prices are softening and we’re not surprised because that normally happens around this time. For reference, the median price often dips about 5% or so during the fall.
PG&E shutting off power: If you didn’t know, PG&E shut off power to more than 700,000 customers for a couple days last week in light of a perceived risk of fire. I’ve been asked if this is going to affect the real estate market. Here’s my take. If this became a frequent issue it’s hard to imagine buyers not considering it when making offers and choosing where to live. If this is an isolated incident though, it’s likely to have no real impact. Of course one other layer here is we could see buyers expecting or appreciating generators being present.
Not all falls are equal: It’s good to remember not all fall seasons are created equal. What I mean is sometimes the fall season will feel pretty dull with larger price cuts and other times the market just feels a little more flat. The verdict is still out on what this coming fall season will look like exactly, but there is no mistaking we are in the midst it now.

The last run on the market before Thanksgiving: There is typically a last run on the market about this time of year. Now that everyone is settled in from vacations and the kids are in school, we usually see a last move to buy before the holidays arrive. This is exactly why there is almost always an uptick in sales volume in December. It’s not that there are more homes that actually sell in December. It’s just there are a higher number of pendings from October and November that end up closing in December.
Rent control: The market hasn’t stopped because of rent control in the City of Sacramento. I wanted to mention this because sometimes we lose sight of seeing the market in the midst of strong feelings and sensational headlines. When looking at 2-4 unit sales there were slightly more this September compared to last year, and pendings are fairly normal for the time being. This doesn’t mean everything is going to be peachy. I’m not saying that at all. I only want to emphasize the market is still moving and over time we’ll understand how it’s all going to play out. By the way, I’ll be doing a rent control Q&A soon.

Modest price growth: Last month we saw most price metrics were up about 2-4% compared to the same month last year in 2018. This is much more subdued growth compared to previous years.
Busting landlords for illegal marijuana grows: The City of Sacramento has been busting landlords for tenants growing cannabis over the legal limit (six plants). This is a huge deal and something to watch because some landlords have been getting excessive fines (we’re talking hundreds of thousands of dollars). This story is seeming to fly under the radar, but there are huge implications for property rights and investing in Sacramento and beyond. The silver lining for many landlords though is the courts have seemed to shoot down the city’s tactics lately.
Meth houses & El Camino: If you’re a Breaking Bad fan you probably already watched El Camino. It only seemed fitting to share the DEA’s published list of known drug labs. Unfortunately the list has not been updated in years, but it’s better than nothing. Here’s a study also on the impact of drug labs on surrounding homes (PDF).
Distressed sales: Ten years ago distressed sales dominated the market and were about 80% of all sales in the region, but now they’re hardly even 1% of sales.

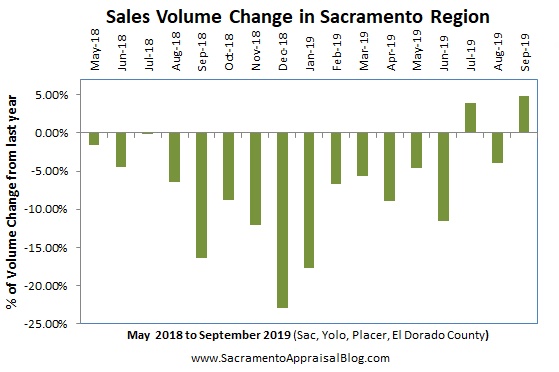
Slumping sales volume: It’s been a lower year of sales volume as we’re down about 7% compared to last year. I know that doesn’t sound like much, but it does translate to about 2,000 less sales. I wouldn’t call this a market meltdown, but we’ve definitely seen a slowdown since sales volume has been lower 15 out of the past 17 months in the Sacramento region. This is still on the lower side of normal, but it’s something to watch over time to understand exactly what it means.
Hesitancy: Buyers are picky about getting into contract as well as staying in contract. On top of that some buyers are feeling hesitant. They wonder if we’re near the peak for this cycle, so they feel less confident about playing the game.
New soccer stadium: We’re finally getting an MLS soccer team in Sacramento after years of drama. Someone asked me if this will affect the market. In short, the stadium is only one piece of the pie in the entire Railyards development. There will be 6,000 to 10,000 housing units and millions of square feet of commercial space including a Kaiser campus. So buyers focus on the entire package including the stadium rather than saying, “Yo, I’m only buying because of the stadium.” Oh, and buyers located multiple miles away are very unlikely to look at fresh neighborhood listings now and say, “Dude, I’m totally going to pay more because there’s a soccer stadium ten to twenty minutes away.”
Soccer KCRA interview: By the way, I did an interview with Channel 3 yesterday about the new soccer stadium.
I could write more, but let’s get visual instead.
FIVE THINGS TO TALK ABOUT:
1) SLOWER GROWTH: The market has continued to show price growth, but it’s been a more modest rate of growth. This is why I’m saying the market is slowing. Let’s remember “slow” is not a dirty word in real estate.


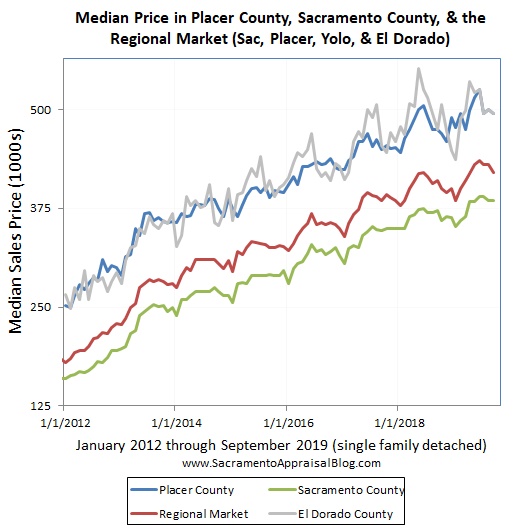
2) PRICE CYCLES: Here’s a look at the past few price cycles in various counties. This is a fascinating way to see the market. What do you notice?


3) LAST YEAR vs THIS YEAR: Last year the market felt dark and many wondered if it was about to take a turn downward. That hasn’t been the vibe so far this year though. Most price metrics are up 2-4% or so this year. I’m not saying the market is perfectly healthy, but it feels profoundly different this year so far. It’s amazing what happens when mortgage rates slide down and help the market feel more normal….


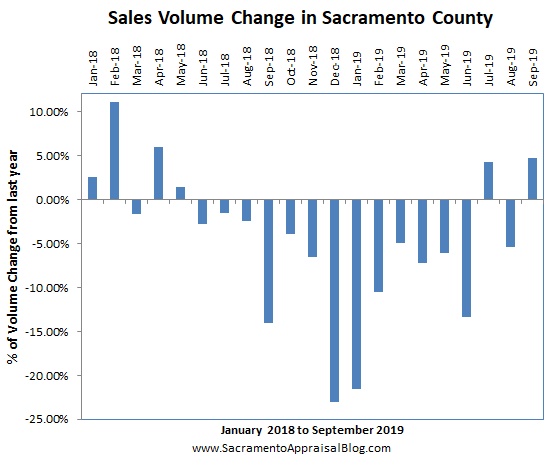
4) VOLUME SLUMP: Volume was actually higher in September compared to last year at the same time, but it was still a pretty low September. In fact, in Sacramento County it was the second lowest September over the past 11 years. It’s important to remember last year was painfully dull, so it’s not all that hard to have a higher sales volume this year, right? The bigger story is sales volume is down in the region by about 7% over the past year. Moreover, volume has been down in the region for 15 out of the last 17 months. This is definitely something to keep on the radar. In my mind this is one of the most important trends to watch because it tells us whether buyers have their foot on the gas or brakes.


5) PRICES ARE SOFTENING FOR THE FALL: The market generally slowed in September in terms of price growth. This is why I’m saying prices feel a bit flat (even though they’re up from last year). This is normal for the time of year.


NOTE: Take El Dorado County data with a grain of salt. Stats change significantly month by month.
Thanks for respecting my content: Please don’t copy my post verbatim or alter the images in any way. I will always show respect for your original work and give you full credit, so I ask for that same courtesy. Here are 5 ways to share my content.
Please enjoy more images now.
SACRAMENTO REGION (more graphs here):


SACRAMENTO COUNTY (more graphs here):


PLACER COUNTY (more graphs here):


EL DORADO COUNTY (more graphs here):


DOWNLOAD 90+ visuals: Please download all graphs here as a zip file. See my sharing policy for 5 ways to share (please don’t copy verbatim).
Questions: What are you seeing out there? Any interesting trends you’re watching? What are you hearing from buyers and sellers lately?
If you liked this post, subscribe by email (or RSS). Thanks for being here.


 How did I get this data? A few years ago our MLS started including fields for “multiple offers” and “number of offers”. I’ve been watching these metrics and reporting on them for the past year or so, but today I’ve taken it to the next level.


