The market is hot again. Sort of. We’ve been seeing a spring seasonal market for a few months, but we seemed to hit an inflection point locally a few weeks ago, and it’s getting REALLY competitive out there. Let’s talk about it. This is a longer post, so scroll by topic or digest slowly.

UPCOMING (PUBLIC) SPEAKING GIGS:
4/12/23 Q&A at Moksa Barrel House (details coming)
4/13/23 Realtist Meeting
5/4/23 Event with UWL TBA
5/10/23 Empire Home Loans event TBA
5/22/23 Yolo YPN event TBA
7/20/23 SAR Market Update (in-person & livestream)
ICE BATH TO BLOODBATH
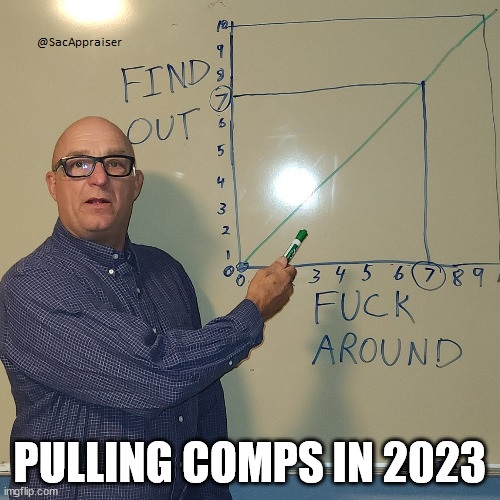
The housing market was an ice bath in the fall of 2022, but now it feels like a bloodbath with the level of competition. I was expecting the market to heat up for the spring, but seeing 45% fewer new listings so far in 2023 in the Sacramento region has changed the trend. This meme is the best way I can describe the market right now (images from Captain America).

BUT VOLUME IS STILL WORSE THAN 2007
The market is starting to feel like 2020 competition, but we have 2007 vibes in terms of sales volume. That’s what is so weird about today. In fact, since late 2022 monthly volume has been worse than 2007 levels in the Sacramento region. Thus, when someone says the market is blazing hot right now, there’s a major asterisk next to that statement.

LOW DEMAND & LOW SUPPLY HAVE MET
The issue today is we’ve had lower demand since buyers have stepped back from the market due to affordability. But now sellers have also stepped back, and it’s caused low demand and low supply to meet. If we had a normal number of listings right now, the market would feel way different. It’s frankly striking to see competition like this in the midst of a market with so many missing buyers.

ACTIVES & PENDINGS
Here’s one of my favorite ways to show the market right now. I find it’s key to look at the number of listings and pendings by price range to get a sense of competition. Do you see how tight the market is in some price ranges? At the moment there are more pendings than actives in every price range under $700,000. It’s especially lopsided under $500,000 though. This dynamic is exactly why we are seeing bidding wars.

And here’s a snapshot of actives vs pendings. This doesn’t have any context, which is a weakness, but I think it’s important to get a quick glance at the numbers. I’ll share this here and there if you like it (let me know). In short, having more pendings than actives is a freakish trend for Sacramento County, and that sort of dynamic is not normal (it happened in portions of 2020 through 2022 when the market was blazing).


BELOW ONE MONTH AGAIN IN SACRAMENTO COUNTY
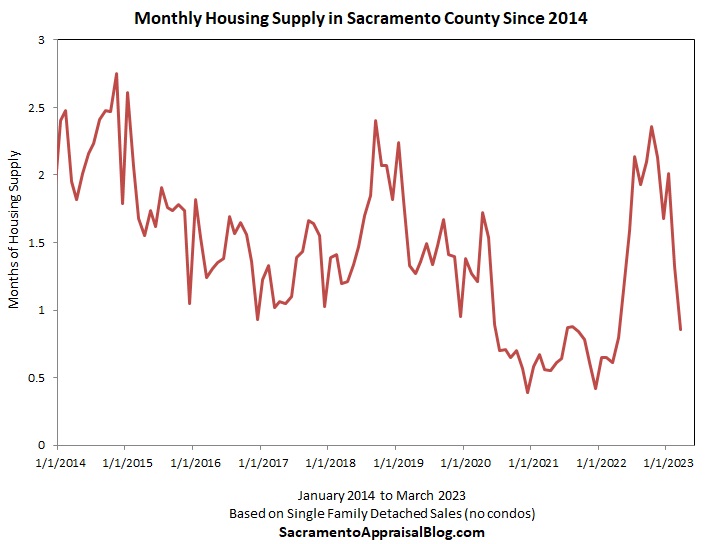
We dipped below one month of housing supply in Sacramento County again. This means there is less than one month worth of active listings available to buyers. It’s making it tight to have fewer listings hit the market.

And a few different counties… Basically, every local county has seen inventory drop lately, but only Sacramento County is below one month so far (the entire region is close though at just under 1.2 months).

BRO, I PREDICTED THIS…
Lots of people are acting like it was so expected to see sellers step back from the market like this. I get it because it makes logical sense since the math doesn’t work for sellers. But it’s also okay to be surprised that we’ve seen a whopping 45% fewer new listings in the region in 2023. And it’s no problem to change our narrative when the stats change. For me, the trend right now makes logical sense, but I’m still shocked to see nearly half of all local sellers sitting out. That’s a stunning trend, and it’s made all the difference today. Here’s a tweet from yesterday to tie in predictions too.

TAME PRICE APPRECIATION THROUGH MARCH
We’ve since a spring bounce with prices in the Sacramento region. This is normal to see, and it’s something that happened even in 2007. We’ll see what the future holds as current pending contracts start closing. I’m definitely seeing a higher percentage of multiple offers among pendings in recent weeks, and there are some really lopsided stories about buyers paying above the asking price too. More on that in time.
Anyway, price appreciation through March has been modest at best (county and regional level). In other words, it’s been a slight uptick, and we haven’t seen explosive price growth like early 2022. Pending price data looks pretty modest technically, but we never know how much properties have gone above the asking price until they actually close, so there is a lag in tracking the trend. This is why on the neighborhood level it’s so important for appraisers to talk to agents to understand what current pendings are in contract for. Keep in mind the trend can be way different at the bottom half of the market, so it’s important to look at each neighborhood and price point separately rather than imposing a county-wide trend on every neighborhood.
All that said, one thing I’m hoping to communicate here is the importance of recognizing that intense competition doesn’t automatically mean early 2022 rapid appreciation. We are in such a weird market right now with subdued supply and subdued demand, and we’re going to have to wait to see what happens with prices. One thing that likely isn’t helping is the extra steroid of the Dream for All program. Lower rates lately can bring some buyers back too. Ultimately, the market will figure it out… Well, and Fed and governmental policy will probably be the x-factor in shaping things.
Let’s keep watching.


SELLERS STILL NEED TO PRICE CORRECTLY
It’s really expensive to overpay in today’s market, so overpricing is a glaring mistake. The properties that are getting bid up are units that check all the boxes and/or homes that are priced lower to generate interest. We are NOT seeing overpriced properties getting 10 offers. I’m also not seeing properties with 30 offers when priced at market value either.
THE MARKET IS NOT NORMAL
On the rosy side of the real estate narrative, it’s easy to say the market is back, but that’s not true. It’s still not affordable for a big chunk of buyers, which is why sales volume has been lousy for so many months. Granted, if we start to see fewer listings over time, then sales volume could also be down because of a lack of listings. I find a “hot” market with rising prices is the preferred narrative among many real estate professionals, but the last thing we need right now is higher prices. Moreover, it’s volume that pays the bills. Not prices. Personally, I’d rather see prices go down so more buyers can participate. That seems healthy to me. But I don’t get to make the rules.
NOT ADMITTING THE MARKET IS HOT
I’m finding some doomers are struggling to talk about fewer new listings changing the dynamic lately. My observation is some who perpetuate a doom narrative are so fixated on the idea of the market imploding that it’s hard to admit that it’s getting hot again. I don’t say this as a guy who is a part of the rosy real estate club. I’m on team data, and my goal is to form perspective based on the stats. I’m just saying it’s felt disingenuous lately with social media conversations where some people are so tied to their dark narrative that they can’t seem to be able to talk about a shifting dynamic. Look, we are not affordable, and it would be really healthy for prices to go down. We’ll see what the future holds in this regard. But let’s not miss out on market analysis and conversations right now.
THE DECLINING BOX
Appraisers need to consider which box to check in appraisal reports right now. The market is a mixed bag for sure, and the trend is going to vary by neighborhood. But if we are market experts, we need to be on top of this and let the stats lead us. If the market has changed in recent weeks and months, this means older sales might need upward adjustments if pendings are now higher. I saw an appraisal report this past week where comps from November and December were used without any adjustments, and that seemed off when looking at neighborhood stats. The appraiser said the market was declining, but the trend has changed lately. I would have at least said the trend was flat with some brewing upward pressure. In my mind, the most important thing right now is to really understand what is happening with the listings and pendings rather than waiting for these properties to close in coming months to see the trend then. I’m really against appraisers saying the market is stable if it is declining. Seriously, I despite that. But I’m also against saying it’s declining if it’s not.
I spoke at the ACTS conference this week, and here’s an example of some language I used recently to describe the market.

By the way, it was really nice to meet so many new friends at the ACTS conference. I’m looking forward to being connected.

I hope this was helpful.
MARKET STATS: I’ll have lots of market stats out this week on my social channels, so watch Twitter, Instagram, LinkedIn, and Facebook.
Questions: What are you seeing happen with prices? Up, down, flat? I’d love to hear your take.
If you liked this post, subscribe by email (or RSS). Thanks for being here.


