A seller thinks his property is worth about one million dollars more than it actually is because he hijacked a price per sq ft from a different house down the street and applied it to his own. Doh!! This happens all the time unfortunately, and it’s an example of how simple real estate math can create big problems. Let’s talk about this, and I also have fresh stats for anyone interested.

THERE ISN’T JUST ONE PRICE PER SQ FT NUMBER TO USE:
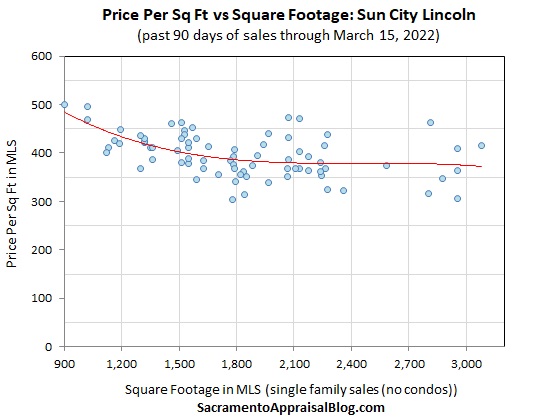
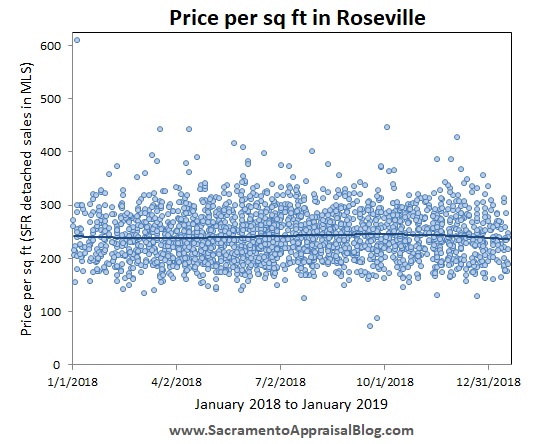
It’s easy to overprice if we’re just looking at price per sq ft instead of actual comps (similar homes). Check out the range of price per sq ft among sales in the wider Sacramento region. There is a massive spectrum depending on size, location, upgrades, etc… In other words, there isn’t just one number that fits all properties in the neighborhood.

DOWNLOAD THIS TEMPLATE:
If anyone wants to create a table like this for your area, I’ve included a template. You just need to find the stats. Download the template here and use however you want. I think it could be cool to do neighborhoods instead of cities too. If you have a Rapattoni MLS system, you can actually use the statistics tab to quickly find the high and low. Do a map or standard search (selecting only closed sales), and then hit the statistics tab. Scroll down to find the data. I double-checked data for multiple areas to be sure it is accurate, and it’s spitting out the right numbers.
NOT STUCK ON THE LOWEST NUMBER
People often get stuck on a lofty price per sq ft because the math gives an incredible answer that people want to hear. I rarely meet anyone stuck on the lowest number in the range unless assets are going to be split and one party is trying to short the other. In conclusion, check your bias in situations like this. Are you using a price per sq ft figure because you’re looking at comps, or are you fixated on a number because it gives you an amazing result?
STARBUCKS CUPS ANALOGY
My favorite way to describe price per sq ft is with Starbucks cups. I’ve used Dad bods and Lamborghinis too. My advice? Use what works for you.
REAL ESTATE CANCELLATION CULTURE
I’ve been getting more questions about cancellations lately, so I ran some stats. I can keep adding to these visuals if it would be helpful (let me know). In truth, I think I need to compare the number of cancellations with the number of active listings somehow since we still have such an anemic supply today. Basically, cancellations have risen, but we’re not at alarming levels. Keep in mind we do have more listings this year, so it seems like we would probably have more cancellations too unless there were many more buyers.


FRESH STATS in 9 COUNTIES:
I’m pulling stats for nine counties these days, and I’ll keep doing so as long as it’s a felt need. You can view all these visuals under the STATS tab on the navigation bar too.
HOW I’M DESCRIBING THE MARKET RIGHT NOW:
The good news is we have more closed sales, more pendings, and more new listings this year, but overall, it’s been pretty mediocre growth with closed sales. Much of the volume growth we’ve seen this year is thanks to Placer and El Dorado County. The market still has historically low supply as we’re missing about 5,000 new listings compared to a normal year, but this year we’ve had about 2,000 extra new listings compared to last year, so sellers aren’t as stuck as one year ago. I think we’re feeling a temperature difference due to more new listings since the gap between sales and listings is wider this year. Yet, the market has been slightly more competitive than normal still when looking at many metrics. Basically, we are now so much closer to normal than the craziness of 2021. Keep in mind buyers are hungry for the good stuff, so there can be intense competition when a property hits the market that checks all the boxes (too many buyers are looking for that one property). With that said, it’s either multiple offers or crickets these days, so sellers need to be ready to find the market through price reductions if buyers aren’t biting. Anyway, more on my socials this week.
IMPORTANT NOTES:
1) Down from 2022: Keep in mind prices are still down from their peak in May 2022, but they are up from one year ago since prices saw a bigger dip for the second half of 2022.
2) Don’t be rigid: Median price and average price change doesn’t translate rigidly. In other words, it would be a mistake to think your value is up X% since the median is up that much. Maybe. Maybe not. Look to the comps.
3) Smaller counties are erratic: I’m not crazy about some of the price stats in the smaller counties since there just aren’t enough sales to be meaningful. Please note smaller counties are grouped in 60-day chunks since stats are erratic with only 30 days. I might even try 90 days instead.

YEAR OVER YEAR


MONTH TO MONTH


I hope this was interesting. Thanks for being here.
Questions: What resonated with you the most above? What price per sq ft stories do you have to share? What did I miss?
If you liked this post, subscribe by email (or RSS). Thanks for being here.