• Skip to primary navigation
  • Skip to main content
  • Skip to primary sidebar

Sacramento Appraisal Blog | Real Estate Appraiser

Real estate appraisals for divorce, estate settlement, loans, property tax appeal, pre-listing and more. We cover Sacramento, Placer and Yolo County. We're professional, courteous and timely.

  • About
  • Appraisals
  • Order
  • Ask Ryan
  • Areas
  • Classes
  • Press
  • Trends
  • Share
  • Contact

Sacramento County real estate trends

It’ll never sell that high (but then it did)

May 17, 2018 By Ryan Lundquist 8 Comments

There’s no way it’s going to sell that high. Have you ever thought that in real estate? Well, let’s talk about a property that many said would never sell at $4.1M, but then it did. I definitely have some takeaways about this lofty condo in Downtown Sacramento, and I hope non-locals will relate to the commentary. Then for those interested I have a huge market update below. Any thoughts?

A few things on my mind about this one sale:

1) Outlier: This sale is a total outlier. It is a big deal, but it’s also completely disconnected from the rest of the market. Can you tell based on the graph?

2) Thin history above $4,000,000: There have literally only been four residential sales ever above $4M in Sacramento County. EVER. So yes, it’s huge news to have a condo close this high, but at the same time let’s not think everything is now worth four million. Here are the sales:

a) Governor’s Mansion in Carmichael in 2004 at $4.1M
b) Sierra Oaks home in 2013 at $4.7M
c) Elk Grove estate in 2005 at $4.6M (sold $1.3M in 2011)
d) Downtown Condo at $4.1M

3) Lamborghini & Camry: Some have said things like, “I can’t afford the market any longer.” But this one “lone ranger” sale isn’t the new comp for everything in town. It’s tempting for sellers to price higher now, but it’s not like someone ten miles away is going to pay more at the $300,000 level because of a multi-million dollar condo sale. If my neighbor bought a Lamborghini, that doesn’t all of a sudden mean I have to pay more for a Camry…

4) An emerging market: There is definitely an appetite for high-end condos in Sacramento, so let’s expect to see this niche market find more expression in coming time. Ultimately the sales office at the Kimpton Sawyer Hotel has done well so far to sell units far above what many locals imagined. Of course the eventual test for these properties will be to see what happens when they hit the resale market in coming years without the benefit of marketing from a Beverly Hills sales agency.

I hope that was interesting or helpful. Anything to add?

-—-—- Big monthly market update (absurdly long on purpose) ———–

The market feels very normal for the spring. Well, I guess what I mean is all the stats are normal, but buyers are pulling the trigger very quickly and we’re seeing multiple offers on just about anything that is priced correctly. One of the bigger stories is sales volume so far in the beginning of 2018 is up 5% in the region. In fact, we’ve seen the strongest start to the year since 2013. Buyers have been starving for more inventory, so they’re gobbling up anything in site as long as it’s not overpriced. But part of the growth in volume these past few months could also stem from some buyers trying to get a slice of real estate pie before interest rates rise.

New recap images: Last month I introduced recap images. Here’s round two, though this month my data from last year is less complete since I tore my knee a year ago (I’m all better now). Anyway, what do you think?

Two quick things:

1) Inventory is increasing: We’re starting to see inventory increase a bit. For years it did nothing but decline, but toward the end of last year it seemed to flatten out, and so far this year we’ve seen some slight upticks. Granted, inventory this past month was only up 3% in the region compared to the same time last year, but that’s better than being perpetually down every single month.

2) The wrong comps with new construction: With more new construction lately, it seems like some sellers are using brand new nearby homes as “comps” for their older homes. Let’s remember the new ones often sell with a hefty price premium, so they really don’t make adequate comps. My advice? Don’t get distracted by the brand new stuff. Try to find older sales that are similar rather than assuming buyers are going to pay the same amount as a new home.

I could write more, but let’s get visual instead.

DOWNLOAD 52 graphs HERE: Please download all graphs here as a zip file. See my sharing policy for 5 ways to share (please don’t copy verbatim).

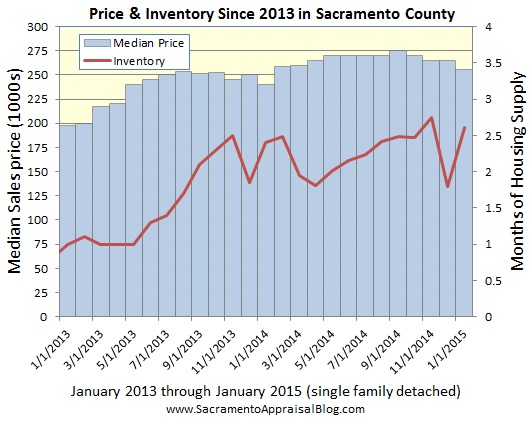
SACRAMENTO COUNTY (more graphs here):

SACRAMENTO REGION (more graphs here):

PLACER COUNTY (more graphs here):

DOWNLOAD 52 graphs HERE: Please download all graphs here as a zip file. See my sharing policy for 5 ways to share (please don’t copy verbatim).

Questions: What do you think of that $4.1M condo sale? What else are you seeing out there in the market? I’d love to hear your take.

If you liked this post, subscribe by email (or RSS). Thanks for being here.

Share:

  • Click to share on Twitter (Opens in new window)
  • Click to share on Facebook (Opens in new window)
  • Click to share on LinkedIn (Opens in new window)

Filed Under: Market Trends Tagged With: April 2018 market graphs, Downtown condo sale record, Home Appraiser, House Appraiser, housing shortage, inventory, lofty condo sale, Placer County real estate trends, rising prices, Sacramento County real estate trends, Sacramento Market Update, sacramento regional housing market, sales volume, trend graphs

Price ceilings & literal ceilings that are too low

July 12, 2017 By Ryan Lundquist 13 Comments

I have two types of ceilings on my mind. How do you know when a market begins to reach its price ceiling for the season? And how low can a ceiling be in a home and still be considered legitimate square footage by an appraiser?

I recently inspected a house where the ceiling was 6 feet 8 inches high. Is that tall enough to count? Is there such a thing as too low? Let’s talk about it. 

How low can a ceiling be? Lots of people think 8 feet is the minimum ceiling height because that’s a common height in most homes, but it’s actually 7 feet according to the American National Standards Institute (ANSI Z765). Technically ANSI says it’s okay to have a ceiling height at 6’4″ under beams though. Keep in mind sometimes a ceiling might have a downward slope like we see with a Tudor or the photo above. When ceilings slope really low, there is something called the “5 foot rule” where the appraiser can count any space above 5 feet as living area as long as over 50% of the ceiling area is at least 7 feet.

When appraisers observe houses with ceilings below 7 feet, they’ll typically email the lender and say, “Hey there, this property has a ceiling less than 7 feet, and that doesn’t cut it according to ANSI standards. How do you want me to proceed?” After hearing that there’s a good chance the lender might not want to do the loan. Of course a property with low ceilings can still have value and even be appraised, but it may need to be marketed to an investor paying cash instead of a buyer using conventional or FHA financing.

Market price ceilings: Switching ceiling gears, how would you know if the market was beginning to reach its price ceiling for the season? That’s a great question to ask since many markets in the United States are going to be doing just that over the next couple of months. As I said in June, the Sacramento market is beginning to slow down even though we don’t see it in the sales stats yet. This doesn’t mean the market is cold or values are declining. It only means we are seeing subtle clues to a slowing market as high altitude values from the spring are at the beginning of a downward seasonal descent.

Umm, please don’t say the market is slowing!!!

At times it’s not very popular in the real estate community to publicly talk about the market slowing, but it’s something that happens nearly every single year. I realize we have big headlines about the market being “hot”, and it really is in many way, but catching the symptoms of a slowing market is key for valuing properties (and it’s good for clients). I suggest starting to watch price reductions more closely because they’ve been increasing lately in Sacramento and this is one of the first signs of a slowing market. Also pay attention to days on market increasing in coming time along with some of the other factors above (including the sales to list price ratio). I highly recommend asking other real estate professionals the question, “What are you seeing out there?” It’s amazing the type of insight you can glean from title reps, loan officers, appraisers, agents, escrow officers, etc…

I hope that was helpful or interesting. Any thoughts?

–——-——- Big monthly market update (it’s long on purpose) ———–——-

Values showed an increase again last month and sales volume was very steady compared to the past few Junes. Overall most price metrics were up 1-2% from last month, though the month prior they increased 2-4%. Inventory is still down about 20% from last year, and properties have been selling like hotcakes in only 9 days (that’s the median). In case you wanted to know, most price metrics are up about 7% from last year. One interesting thing to watch is FHA sales are starting to sag more noticeably as they ticked down a few percentage points to 21% of the market in Sacramento County. Granted, 1 in 5 sales is still quite a bit of FHA volume, but last year we were seeing 1 in 4 sales go FHA. It’s easy to think this means first-time buyers are getting squeezed out by Bay Area buyers, but that’s not really the case. My sense is the downtrend is due to more would-be FHA buyers using competitive conventional products instead of FHA. Lastly, it’s worth noting Curbed has a glowing article about Sacramento (cool that they quoted me too). This article is starting to go viral and it’s bound to get many locals pumped on how “hot” the Sacramento market is. Yet despite being “hot” in many ways, let’s remember to look for the signs of a slowing market because we have to realize the market usually hits its seasonal price ceiling right about now (but we won’t see it in the sales stats for a while). I could go on and on with words, but let me share some graphs to show the market visually.

DOWNLOAD 74 graphs (and a stat sheet) HERE: Please download all graphs in this post and more here as a zip file (includes a stat sheet too). See my sharing policy for 5 ways to share (please don’t copy verbatim).

Sacramento County graphs this month (more graphs & stats here):

Sacramento Regional graphs this month (more graphs & stats here):

Placer County graphs this month (more graphs & stats here):

DOWNLOAD 74 graphs (and a stat sheet) HERE: Please download all graphs in this post (and more) here as a zip file. See my sharing policy for 5 ways to share (please don’t copy verbatim).

Questions: Any low ceiling stories to share? Is the price ceiling for the season just about here? Did I miss anything? I’d love to hear your take.

If you liked this post, subscribe by email (or RSS). Thanks for being here.

Share:

  • Click to share on Twitter (Opens in new window)
  • Click to share on Facebook (Opens in new window)
  • Click to share on LinkedIn (Opens in new window)

Filed Under: Market Trends Tagged With: 5 ft rule, ANSI, appraisals, Appraiser, average sales price, avg price per sq ft, cash purchases, ceilings are too low, days on market, FHA, foreclosures, Home Appraiser, hot market, house appraisals, increasin market, Median Price, Placer County real estate trends, Sacramento County real estate trends, Sacrametion Regional Market, seasonal slow down, sensational news, trend graphs

Seeing the real estate market without numbers (and a big Sacramento update)

June 13, 2016 By Ryan Lundquist 18 Comments

It’s not just about the numbers. Like many, I’m a huge fan of getting deep into real estate stats, but the truth is there are so many other ways to sniff out what the market is doing. Thus I’ve created a list of some of the things on my radar lately that help say something about the temperature of the market. Then for those interested, let’s crunch some numbers with my big monthly Sacramento market update. I’d love to hear your take. Any thoughts?

How to see the market moving - image purchased and used with permission from 123rf - Sacramento Appraisal Blog

Ways to see the real estate market without numbers:

  1. Facebook Posts: I can’t tell you how many posts I’ve seen lately saying, “Hey, my friend needs to rent a house. Anyone have something?” Seeing an increasing number of posts like this on Facebook or Nextdoor.com is definitely a symptom of rising rents and scarce inventory.
  2. Celebrity Flipping Seminars: Last week an HGTV flipping couple hosted a 4-day “how to flip” seminar in Sacramento, and this week a different “guru” is coming to town. If anything, this tells us the market for flipping has passed.
  3. Riskier Loans: As more lower-down payment loan products hit the market, it reminds us buyers need more options to afford higher prices.
  4. Sacramento Kings vs. Market - jokeSacramento Kings Wins: Here is an image to show the relationship between an NBA team winning and the housing market. Okay, there really isn’t a connection, but it almost looks like there is (you can make numbers say whatever you want).
  5. Less Property Tax Appeals: As the market has improved, assessment appeals have declined every year since 2008 in Sacramento County. Right now home owners are enjoying equity again and they’re hardly paying attention to their property tax bills. Here is an image to back that up.
  6. More Divorces: As the housing market has rebounded, it seems there are more divorces. I’ll admit stats are tricky in that some sources say divorces are increasing and others say they are not. It may be my personal experience, but I’ve done more divorce appraisals these past 2-3 years than I have in the previous ten years.
  7. Builders Being Less Cooperative: I’ve heard from several agents lately about local builders being less cooperative with agents representing buyers. That’s fairly normal for builders of course, though being less cooperative is certainly a luxury afforded by a market with tight inventory too. In other words, if the market had three times the housing supply, conversations might go differently at the sales office.
  8. The word “shift”: There is so much emphasis right now on the market shifting or maybe doing so in coming time. When the real estate community uses terms like shift, change, correction, or bubble, it can sometimes highlight what the market is doing (or at least what is on the mind of the real estate community).

Question: What is #9? I’d love to hear in the comments below. By the way, scroll to the bottom if you want to see some of my recent woodworking projects.

—————– For those interested, here is my big market update  —————–

Big monthly market update post - sacramento appraisal blog - image purchased from 123rfTwo ways to read the BIG POST:

  1. Scan the talking points and graphs quickly.
  2. Grab a cup of coffee and spend time digesting what is here.

DOWNLOAD 70 graphs HERE: Please download all graphs in this post (and more) here as a zip file (or send me an email). Use them for study, for your newsletter, or some on your blog. See my sharing policy for 5 ways to share (please don’t copy verbatim). Thanks.

Quick Market Summary: Yep, the stats show the market has been increasing. This doesn’t mean every single price range or neighborhood is going up in value, but county and regional data are definitely showing that trend overall. One of the bigger narratives is that housing inventory is still down by 15% in the region compared to last year. Sales volume has been up slightly for the year and it took 6 less days to sell last month compared to the previous month. For context, last year at the same time it was taking an average of 8 days longer to sell. This reminds us the market has been more competitive this year compared to last year, though don’t take that to mean value increases have been extremely aggressive. Last month the median price increased by nearly 2% in the region, and the average price per sq ft increased by 2.5%. Overall most value stats are up a good 8-10% since last year, though remember it’s not the same market as it was in 2005 when we’d say, “My house went up by $10,000 last month.” It’s still important to price correctly unless you want to sit instead of sell.

Sacramento County:

  1. It took an average of 27 days to sell a home last month, which is 4 days less than the previous month.
  2. The sales to list price ratio was 100% last month.
  3. It took 8 less days to sell this May compared to last May.
  4. Sales volume was up nearly 4% in May 2016 from May 2015.
  5. There is only 1.35 months of housing supply in Sacramento County.
  6. Housing inventory is 22% lower than it was last year at the same time.
  7. The median price increased by 3% last month.
  8. The median price is 9.6% higher than the same time last year.
  9. The avg price per sq ft increased by 1.8% last month.
  10. The avg price per sq ft is 9.9% higher than the same time last year.

Some of my Favorite Graphs this Month:

Median price since 2013 in sacramento county

monthly inventory is sacramento county since 2001 - by sacramento appraisal blog

inventory - May 2016 - by home appraiser blog

CDOM in Sacramento County - by Sacramento Regional Appraisal Blog

price metrics since 2015 in sacramento county - look at all

market in sacramento - sacramento appraisal group

SACRAMENTO REGIONAL MARKET:

  1. It took 6 less days to sell last month compared to the previous month.
  2. It took 8 less days to sell this May compared to last May.
  3. The sales to list price ratio was 99% in the region last month.
  4. Short sales and REOs were both 3% of sales last month.
  5. There is 1.6 months of housing supply in the region right now.
  6. Housing inventory is 15.6% lower than it was last year at the same time.
  7. The median price increased 1.7% last month from the previous month.
  8. The median price is 6.8% higher than the same time last year.
  9. The avg price per sq ft increased 2.5% last month.
  10. The avg price per sq ft is 8.4% higher than the same time last year.

Some of my Favorite Regional Graphs:

median price sacramento placer yolo el dorado county

sacramento region volume - FHA and conventional - by appraiser blog

sales volume 2015 vs 2016 in sacramento placer yolo el dorado county

Regional Inventory - by Sacramento regional appraisal blog

days on market in placer sac el dorado yolo county by sacramento appraisal blog

median price and inventory in sacramento regional market

Regional market median price - by home appraiser blog

PLACER COUNTY:

  1. It took 2 less days to sell a house last month than April.
  2. It took 1 less day to sell this May compared to last May.
  3. Sales volume was up 3% in May 2016 compared to last May.
  4. FHA sales were 16% of all sales last month.
  5. Cash sales were 17% of all sales last month.
  6. There is 1.84 months of housing supply in Placer County right now.
  7. Housing inventory is 12.4% lower than it was last year at the same time.
  8. The median price is about the same as it was the previous month.
  9. The median price is up 7% from May 2015.
  10. Short sales were 2.1% and REOs were 1.7% of sales last month.

Some of my Favorite Placer County Graphs:

number of listings in PLACER county - 2016

Placer County sales volume - by sacramento appraisal blog

months of housing inventory in placer county by sacramento appraisal blog

Placer County price and inventory - by sacramento appraisal blog

days on market in placer county by sacramento appraisal blog

Placer County housing inventory - by home appraiser blog

I hope this was helpful and interesting.

My Latest Woodworking: By the way, I know this post has been ridiculously long already (on purpose since it’s my big monthly market update), but here are some of my recent woodworking projects. If you didn’t know, I like to tinker and create.

Ryan woodworking 2

Ryan woodworking 1

DOWNLOAD 70 graphs HERE: Please download all graphs in this post (and more) here as a zip file (or send me an email). Use them for study, for your newsletter, or some on your blog. See my sharing policy for 5 ways to share (please don’t copy verbatim). Thanks.

Question: Any other market insight you’d like to add? I’d love to hear your take.

If you liked this post, subscribe by email (or RSS). Thanks for being here.

Share:

  • Click to share on Twitter (Opens in new window)
  • Click to share on Facebook (Opens in new window)
  • Click to share on LinkedIn (Opens in new window)

Filed Under: Market Trends Tagged With: bank-owned sales, days on market, housing inventory, low housing supply, Placer County real estate, Sacramento Appraisal Blog, Sacramento County real estate trends, sacramento regional appraisal blog, sacramento regional market trends, Short Sale, values going up, values increasing

The slowish real estate market in January

February 10, 2015 By Ryan Lundquist 4 Comments

January is usually a slow real estate month. That’s nothing shocking. Yet it’s always interesting to see how the market begins to maybe get a sense for where it might go during the year. Today let’s take a look at 6 specific areas of the market in Sacramento, which will help us understand and explain the way things are moving.

Longer on purpose: If you’re new to subscribe (thank you), most of my posts are not this long. But twice a month I break down the trends so we can better see the market. Most of my other posts are general enough to apply anywhere in the United States. Is your market similar though? I’m curious.

Two ways to read this post:

  1. Scan the talking points and graphs quickly.
  2. Grab a cup of coffee and spend a few minutes digesting what is here.

the story of the market in january

Email me if you want the graphs: If you would like all the graphs in this post (and 15 more), send me an email (make sure to write “I want the market graphs” in the header). You can use some of these in your newsletter, on your blog, and in other social spaces. See my sharing policy for 5 ways to share.

1) The reality of the slower seasonal market right now:

seasonal dip in sacramento

It’s easy to freak out this time of year when values take a dip. It can feel the market is falling apart when we see price figures decline. Yet the market almost always softens at the end of the year and in the very beginning of the year. Knowing this can help you communicate well with clients and even plan for business. Remember that sales stats usually see a huge uptick in March, and this signifies the Spring market. Technically most of the sales in March actually get into contract in February though, which reminds us the Spring market hits its stride in February.

2) The median price softened by 3% last month:

price metrics since 2014 in sacramento county

context for median price since the real estate bubble by sacramento appraisal blog

median price and inventory since 2013 - by sacramento appraisal blog

The median sales price took a 3% dip in January to $256,000. It might sound extreme to see the market soften this much, but last year saw the same exact 3% dip as you can see in the image above.

3) It took an average of 60 days to sell a house in January:

DOM in Sacramento County

On average it took 60 days to sell a house last month in Sacramento County. This is up from 48 days one year ago in January 2014, but down from about 90 days in January 2012.

CDOM in Sacramento County - by Sacramento Appraisal Blog

It’s important to realize the market is not the same at every price range. In other words, some price ranges tend to take longer to sell than others. Generally speaking, the higher the price, the longer it takes to sell. Keep in mind there were only 9 sales at 750K-1M and two above 1M, so take those stats with a grain of salt.

4) Sales volume hit its lowest point in 8 years:

sales volume in Sacramento County

Sales volume was at its lowest point in 8 years last month. On one had that sounds alarming, but it’s really the story of the market these days. Last year saw slightly more sales at this time, so this year isn’t anything out of the ordinary for the current market. Volume is simply down right now as a whole, and we can look at this as the new norm for a while until the market can handle more inventory and more demand (when the economy improves).

january sales in sacramento county

It’s easy to get sensationalistic about having such a low volume of sales last month, but the graph above shows 15 years of January sales in Sacramento County. What do you notice? January almost always comes in last place for sales volume. In short, don’t freak out.

sales volume in fall and winter through 2015 - by sacramento appraisal blog

Lastly, remember to consider what usually happens in February. Sometimes February is right in sync with January, but other times there is slightly more volume. We’ll see what this year brings, but knowing how the market works makes you an asset to clients.

5) Housing inventory increased last month (technically):

inventory in sacramento county  Since 2013 - by sacramento appraisal blog

Inventory increased last month to 2.61 months of housing supply. This is slightly higher than it was one year ago, and exponentially higher than 2013 when there was only one month’s worth of homes for sale. Remember that inventory is the relationship between the number of active listings as of the first of the month divided by sales from the previous month. This means if there are VERY few sales in a month, inventory will actually sound much higher than it actually is. In short, an inventory at 2.61 months sounds like it’s on the higher side, but being that sales volume was really low last month, this figure at 2.61 doesn’t really mean the same thing as it would in the summer when there are far more sales.

months of housing inventory by sacramento appraisal blog

Housing inventory is never the same at every price range. This reminds us yet again there are many markets within a market. In this case, the higher the price, the more inventory there is.

inventory during fall and winter 2 - by sacramento appraisal blog

number of listings in sacramento - January 2015 - by home appraiser blog

6) Interest rates continue to decline:

interest rates by sacramento appraisal blog since 2011

Low interest rates are like fuel for the housing market since they create more demand by drawing buyers into the market. That is what happened in 2012 when rates went below 4% (for the first time ever), and it’s likely going to get some buyers off the fence right now.

interest rates by sacramento appraisal blog

Real estate is never just about supply and demand. There are so many “layers of the market” that are working to impact the direction of values. I hope this was helpful to create some context and conversation.

Share: Please feel free to share this link with clients, and see my sharing policy for 5 ways you can share my content so we’re on the same page about what it means to “share”.

Questions: What are you seeing out there? How does the market feel to you? Anything you’d add?

If you liked this post, subscribe by email (or RSS). Thanks for being here.

Share:

  • Click to share on Twitter (Opens in new window)
  • Click to share on Facebook (Opens in new window)
  • Click to share on LinkedIn (Opens in new window)

Filed Under: Market Trends Tagged With: appraiser market trends, days on market increasing, home appraisals, housing inventory, housing market in Sacramento, interest rates, January 2015 housing market, real estate graphs, Sacramento County real estate trends, sales volume, the seasonal real estate market

  • Go to page 1
  • Go to page 2
  • Go to Next Page »

Primary Sidebar

Connect with Ryan

 Facebook Twitter LinkedIn YouTube Instagram

Subscribe to Weekly Post

* indicates required

Search this site

Blog Categories

  • Appraisal Stuff (408)
  • Bankruptcy (3)
  • Divorce (4)
  • Estate Settlement (6)
  • FHA Appraisal Articles (56)
  • Internet (53)
  • Market Trends (486)
  • Photos from the Field (126)
  • Property Taxes (70)
  • Random Stuff (231)
  • Resources (566)
  • Videos (161)

Blog Archives: 2009 – 2021

Lundquist Appraisal Links

  • Appraisal Order Form
  • Appraisal Website
  • Rancho Cordova Appraiser Website
  • Sacramento Appraisal Blog Sitemap
  • Sacramento Real Estate Appraiser Facebook Page
  • Twitter: Sacramento Appraiser (@SacAppraiser)
  • YouTube: Sacramento Appraiser Channel

Most Recent Posts

  • The housing market feels like chaos
  • An explosion of appraisal waivers. Is that good or bad?
  • Skyrocketing prices aren’t happening everywhere
  • The housing market feels like a crazy auction
  • Are appraisers keeping up with rapid price growth?
  • How much have prices risen since the bottom of the market?
  • How long can this market keep going?
  • What is your housing persona?
  • Rapid price growth & the Gilmore Girls next door
  • Are first-time buyers targeting 2-4 unit properties?

Disclaimer

First off, thank you for being here. Now let's get into the fine print. The material and information contained on this website is the copyrighted property of Ryan Lundquist and Lundquist Appraisal Company. Content on this website may not be reproduced or republished without prior written permission from Ryan Lundquist.

Please see my Sharing Policy on the navigation bar if you are interested in sharing portions of any content on this blog.

The information on this website is meant entirely for educational purposes and is not intended in any way to support an opinion of value for your appraisal needs or any sort of value conclusion for a loan, litigation, tax appeal or any other potential real estate or non-real estate purpose. The material found on this website is meant for casual reading only and is not intended for use in a court of law or any other legal use. Ryan will not appear in court in any capacity based on any information posted here. For more detailed market analysis to be used for an appraisal report or any appraisal-related purpose or valuation consulting, please contact Ryan at 916-595-3735 for more information.

There are no affiliate links on this blog, but there are three advertisements. Please do your homework before doing business with any advertisers as advertisements are not affiliated with this blog in any way. Two ads are located on the sidebar and one is at the bottom of each post. The ads earn a minor amount of revenue and are a simple reward for providing consistent original content to readers. If you think the ads interfere with your blog experience or the integrity of the blog somehow, let me know. I'm always open to feedback. Thank you again for being here.

Copyright © 2021 Sacramento Appraisal Blog